ANONVA test. Perform the ANONVA test in Statistics and explain the group if any of the...
ANONVA test. Perform the ANONVA test in Statistics and explain the group if any of the stores outperform the others. Explain how you arrived at your answer. Be sure to share the null and alternative hypotheses. The p-value is 0.966.
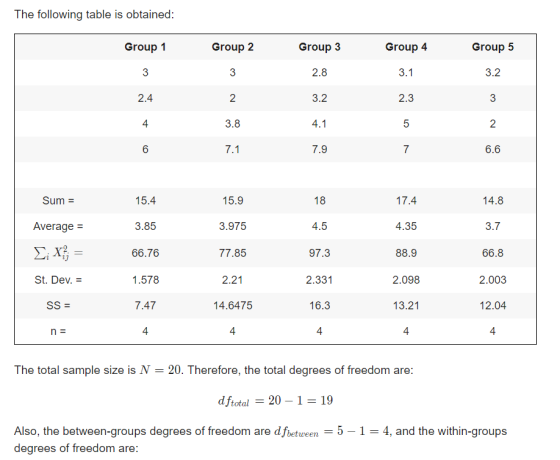
January-March Franchise Performances are: Store 1 (3), Store 2 (3), Store 3 (2.8) ,Store 4 (3.1), Store 5 (3.2).
April-June Franchise Performances are: Store 1 (2.4), Store 2 (2), Store 3 (3.2), Store 4 (2.3), Store 5 (3).
July-September Franchise Performances are: Store 1 (4), Store 2 (3.8), Store 3 (4.1), Store 4 (5), Store 5 (2).
October-Dec. Franchise Performances are: Store 1 (6), Store 2 (7.1), Store 3 (7.9), Store 4 (7), Store (6.6).
P-Value is 0.966.
Homework Answers
Add Answer to:
ANONVA test. Perform the ANONVA test in Statistics and explain
the group if any of the...
Parametirc test or not: Test statistic: p-value: decision: Is There A Difference Between the Means?
Parametirc test or not:Test statistic:p-value:decision:Is There A Difference Between the Means?6.7 6.2 3.1 310.3 10 5 5.56.9 5.5 3.3 3.110.5 6.3 4.3 5.44.5 4.6 1.8 25.6 5.6 2 2.65.9 6.1 2.1 2.58 11.7 4 4.68 7.4 3.3 3.15.8 5.2 3.1 2.96 7.3 3.0 3.28.7 5.3 2.7 36 5.5 2.1 2.27.2 6.3 3.5 3.25.9 4.6 2.9 3.46 7.4 3 3.37.2 7.8 3.7 3.48.6 9.4 5.1 5.77.2 8.1 2.8 3.15.8 5.4 2.2 1.83.3 4 1.7 1.86.8 5.1 2 1.83.7 3.5 2.2 2.112...
Recent research indicates that the effectiveness of antidepressant medication is directly related to the severity of...
Recent research indicates that the effectiveness of antidepressant medication is directly related to the severity of the depression (Khan, Brodhead, Kolts & Brown, 2005). Based on pretreatment depression scores, patients were divided into four groups based on their level of depression. After receiving the antidepressant medication, depression scores were measured again and the amount of improvement was recorded for each patient. The following data are similar to the results of the study. Low Moderate High Moderate Moderately Severe Severe 1.2...
• 1. What are the quarterly growth rates (Percentage Change From Preceding Period in Real Gross...
 • 1. What are the quarterly growth rates (Percentage Change From Preceding Period in Real Gross Domestic Product) for the U.S. economy for the last six quarters? Report those numbers in your submission 2. What is the average of those 6 quarters? . 3. Is the average of those growth rates above or below the long-run U.S. annual growth rate of 3.5 percent? Bureau of Economke Analysis Table 1.1.1. Percent Change From Preceding Period in Real Gross Domestic Product Percent...
The data on the below shows the number of hours a particular drug is in the...
The data on the below shows the number of hours a particular drug is in the system of 200 females. Develop a histogram of this data according to the following intervals: Follow the directions. Test the hypothesis that these data are distributed exponentially. Determine the test statistic. Round to two decimal places. (sort the data first) [0, 3) [3, 6) [6, 9) [9, 12) [12, 18) [18, 24) [24, infinity) 34.7 11.8 10 7.8 2.8 20 9.8 20.4 1.2 7.2...
Statistics for people who (think they) hate statistics 4th Edition Using the data in Chapter 15...
Statistics for people who (think they) hate statistics 4th Edition Using the data in Chapter 15 Data Set 1 to answer the questions below. Do the analysis manually or using the Data Analysis tools in excel. a. Compute the correlation between motivation and GPA. b. Test for the significance of the correlation coefficient at the .05 level using a two-tailed test. c. The more highly you are motivated, the more you will study- true or false? which did you select...
I need help from someone experienced in Minitab. Inferences about Rho (ρ) or rank correlation (You may choose either of these tests) be sure to tell me how to preform the test on minitab and what it...
I need help from someone experienced in Minitab. Inferences about Rho (ρ) or rank correlation (You may choose either of these tests) be sure to tell me how to preform the test on minitab and what it could mean. I have attached the data in a word file. Thanks Study Hours GPA 5 3.1 4 2.3 10 3.437 8 3.3 2 2.5 5 2.7 15 3.8 10 3.8 14 3.85 4 2.95 6 2.85 10 3.48 0 2.2 20 3.7...
Levi-Strauss Co manufactures clothing. The quality control department measures weekly values of different suppliers for the...
Levi-Strauss Co manufactures clothing. The quality control department measures weekly values of different suppliers for the percentage difference of waste between the layout on the computer and the actual waste when the clothing is made (called run-up). The data is in table #11.3.3, and there are some negative values because sometimes the supplier is able to layout the pattern better than the computer ("Waste run up," 2013). Do the data show that there is a difference between some of the...
A product has three quality characteristics. The nominal values of these quality characteristics and their sample...
 A product has three quality characteristics. The nominal values
of these quality characteristics and their sample covariance matrix
have been determined from the analysis of 30 preliminary samples of
size n=10 as it is show in the Excel file. The sample means for
each quality characteristic for 15 additional samples of size n=10
are shown in table. Is the process in statistical control?
X2 Tz Sample number 1 2 [1.40 1.021.05] S = 1.02 1.350.98 11.05 0.98 1.20) 3.1 3.3...
A product has three quality characteristics. The nominal values
of these quality characteristics and their sample covariance matrix
have been determined from the analysis of 30 preliminary samples of
size n=10 as it is show in the Excel file. The sample means for
each quality characteristic for 15 additional samples of size n=10
are shown in table. Is the process in statistical control?
X2 Tz Sample number 1 2 [1.40 1.021.05] S = 1.02 1.350.98 11.05 0.98 1.20) 3.1 3.3...
The table below gives the birth weights in pounds of piglets in 8 randomly selected litters...
The table below gives the birth weights in pounds of piglets in 8 randomly selected litters from large number of litters in a state. Litter 1 2 3 4 5 6 7 8 2.0 3.5 3.3 3.2 2.6 3.1 2.6 2.5 2.8 2.8 1.6 3.3 2.6 2.9 2.2 2.4 3.3 3.2 3.6 3.2 2.9 3.1 2.2 3.0 3.2 3.5 3.1 1.9 2.0 2.5 2.5 1.5 4.4 2.3 3.2 3.3 2.0 1.2 3.6 2.4 3.3 2.5 2.1 1.2 1.9 2.0 2.9 ...
1. A blue fair 6-sided dice and a red fair 6-sided dice are rolled at the...
 1. A blue fair 6-sided dice and a red fair 6-sided dice are rolled at the same time. a) What is the probability of the sum of the dice equals 7, given 1 2 3 4 5 6 at least one of the dice shows a 3? 1 (1.1) (1.2) (1.3) (1.4) (1.5) (1.6) 2 (2.1) (2.2) (2.3) (2.4) (2.5) (2.6) (3.1) (3.2) (3.3) (3.4) (3.5) (3.6) (4.1) (4.2) (4.3) (4.4) (4.5) (4.6) 5 (5.1) (5.2) (5.3) (5.4) (5.5) (5.6)...
 • 1. What are the quarterly growth rates (Percentage Change From Preceding Period in Real Gross Domestic Product) for the U.S. economy for the last six quarters? Report those numbers in your submission 2. What is the average of those 6 quarters? . 3. Is the average of those growth rates above or below the long-run U.S. annual growth rate of 3.5 percent? Bureau of Economke Analysis Table 1.1.1. Percent Change From Preceding Period in Real Gross Domestic Product Percent...
 A product has three quality characteristics. The nominal values
of these quality characteristics and their sample covariance matrix
have been determined from the analysis of 30 preliminary samples of
size n=10 as it is show in the Excel file. The sample means for
each quality characteristic for 15 additional samples of size n=10
are shown in table. Is the process in statistical control?
X2 Tz Sample number 1 2 [1.40 1.021.05] S = 1.02 1.350.98 11.05 0.98 1.20) 3.1 3.3...
A product has three quality characteristics. The nominal values
of these quality characteristics and their sample covariance matrix
have been determined from the analysis of 30 preliminary samples of
size n=10 as it is show in the Excel file. The sample means for
each quality characteristic for 15 additional samples of size n=10
are shown in table. Is the process in statistical control?
X2 Tz Sample number 1 2 [1.40 1.021.05] S = 1.02 1.350.98 11.05 0.98 1.20) 3.1 3.3...
 1. A blue fair 6-sided dice and a red fair 6-sided dice are rolled at the same time. a) What is the probability of the sum of the dice equals 7, given 1 2 3 4 5 6 at least one of the dice shows a 3? 1 (1.1) (1.2) (1.3) (1.4) (1.5) (1.6) 2 (2.1) (2.2) (2.3) (2.4) (2.5) (2.6) (3.1) (3.2) (3.3) (3.4) (3.5) (3.6) (4.1) (4.2) (4.3) (4.4) (4.5) (4.6) 5 (5.1) (5.2) (5.3) (5.4) (5.5) (5.6)...
Most questions answered within 3 hours.
-
How high must a pointed arch be if it is to span a
space 4.2 m...
asked 2 minutes ago -
A housepainter who weighs 750 N stands 0.6 m from one end of a
2.0 m...
asked 4 minutes ago -
Implement Singly Linked List detectLoop in Java.
It would check whether the linked list contains a...
asked 7 minutes ago -
A small mailbag is released from a helicopter that is descending
steadily at 2.10 m/s.
After...
asked 7 minutes ago -
Write a C – program that calls a user-defined function from
within main() that determines the...
asked 11 minutes ago -
For a 2-Level design, with 8 factors, a recommended screening
design model is:
a. Taguchi L12...
asked 51 minutes ago -
1. Define a function in python that returns the sum of the
following 4 lists. Remember...
asked 42 minutes ago -
Elspeth, associate research specialist for a marketing research
firm in a large Midwestern city, had just...
asked 42 minutes ago -
If domestic savings are insufficient to finance domestic private
investment and exports are greater than imports,...
asked 57 minutes ago -
Q.4.
Use the format in Exhibit 9-1 to compute the ending LIFO
inventory and cost of...
asked 1 hour ago -
Discuss the different receiving and dispatch equipment required
for uploading and loading different types of material...
asked 1 hour ago -
Which of the following is true for simultaneous testing?
a. Net specificity is greater than the...
asked 1 hour ago