
Homework Answers


Add Answer to:
Consider an economy that produces and consumes apples and computers as shown in the table below:...
5. Real Versus homihal GDP Consider a simple economy that produces two goods: apples and muffins....
 5. Real Versus homihal GDP Consider a simple economy that produces two goods: apples and muffins. The following table shows the prices and quantities of the goods over a three-year period. Apples Price Quantity (Dollars per apple) (Number of apples) Muffins Quantity (Dollars per muffin) (Number of muffins) Price 125 Year 2018 2019 2020 170 150 200 230 170 Use the information from the preceding table to fill in the following table. Nominal GDP (Dollars) Real GDP (Base year 2018,...
Consider an economy with two goods produces, computers and bicycles. The following Table summarizes the production...
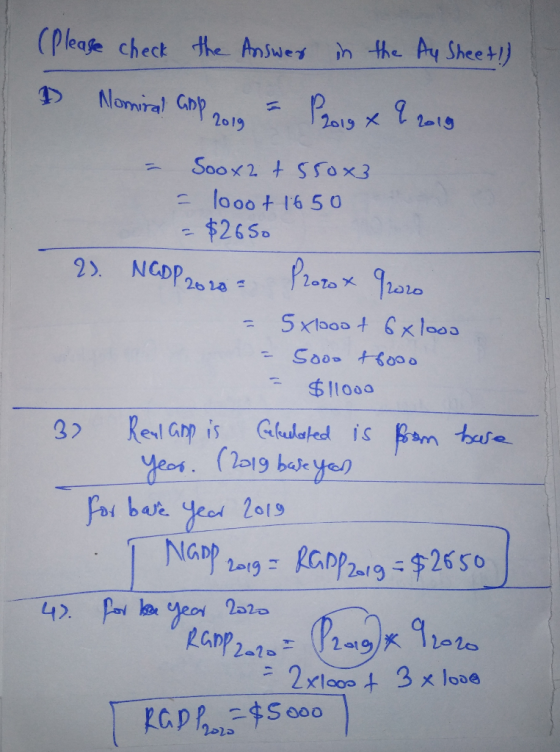
Consider an economy with two goods produces, computers and bicycles. The following Table summarizes the production and price information of these two goods over two years: Price Quantity Year 1 computers: price:500 quantity:10 bicycles: price:50 quantity:100 Year 2 computers: price:600 quantity:20 bicycles: price:80 quantity:120 2.1 Compute the Nominal GDP in both years. What is the rate of growth of nominal GDP? 2.2 Compute the Real GDP in both years using Year 1 as the base year. What is the rate...
1. Assume an economy that only produces pineapples, snorkels and umbrellas. With data from the table...
 1. Assume an economy that only produces pineapples, snorkels and umbrellas. With data from the table below, answer the following questions: Item Pineapples Snorkels Umbrellas Current Period Quantity Price 4,240 $1.30 5,000 $10.00 1,060 $100.00 Base Period Quantity Price 4,240 $1.00 5,000 S8.00 1,060 $100.00 a. Estimate nominal GDP for both periods b. Estimate real GDP for both periods utilizing prices from the base period c. Estimate the inflation rate for the current period utilizing the growth rates in nominal...
5. Real versus nominal GDP Consider a simple economy that produces two goods: apples and muffins....
 5. Real versus nominal GDP Consider a simple economy that produces two goods: apples and muffins. The following table shows the prices and quantities of the goods over a three- year period. Apples Price Quantity (Dollars per apple) (Number of apples) Year 2018 2019 115 Muffins Price Quantity (Dollars per muffin) (Number of muffins) 175 180 160 150 2020 100 Use the information from the preceding table to fill in the following table. Nominal GDP (Dollars) Real GDP (Base year...
Question 11 44 pts Assume that an economy produces only three goods; Computers, cars, and pizza. Table 1 gives the price and quantity for each good and the number of employed and unemployed individuals for the years 2017-2020. Table 2 gives the fixed bask
 Question 11 44 pts Assume that an
economy produces only three goods; Computers, cars, and pizza. Table 1
gives the price and quantity for each good and the number of employed
and unemployed individuals for the years 2017-2020. Table 2 gives the
fixed basket used for calculating the CPI. Assume that the base year is
2018! Table 1 - Price and Quantity of Goods Sold in 2017-2020 2017 2018
2019 2020 Р Q 20 Q 15 Computers Р $400/unit $18,000/unit...
Question 11 44 pts Assume that an
economy produces only three goods; Computers, cars, and pizza. Table 1
gives the price and quantity for each good and the number of employed
and unemployed individuals for the years 2017-2020. Table 2 gives the
fixed basket used for calculating the CPI. Assume that the base year is
2018! Table 1 - Price and Quantity of Goods Sold in 2017-2020 2017 2018
2019 2020 Р Q 20 Q 15 Computers Р $400/unit $18,000/unit...
Fruitland is a closed economy that always produces and consumes 50 apples and 50 bananas. Initially...
Fruitland is a closed economy that always produces and consumes 50 apples and 50 bananas. Initially both apples and bananas cost $1 each. Then demand shifts, so the price of apples doubles to $2 and the price of bananas halves to 50 cents, but production and consumption of apples and bananas stays the same. Calculate the effect on: Nominal GDP, Real GDP, the GDP Deflator, and the Consumer Price Index.
5. Real versus nominal GDP Consider a simple economy that produces two goods: pens and erasers....
5. Real versus nominal GDP Consider a simple economy that produces two goods: pens and erasers. The following table shows the prices and quantities of the goods over a three-year period. Year Pens Erasers Price Quantity Price Quantity (Dollars per pen) (Number of pens) (Dollars per eraser) (Number of erasers) 2018 2 115 5 175 2019 4 150 2 180 2020 1 100 2 160 Use the information from the preceding table to fill in the following table. Year Nominal...
5. Real versus nominal GDP Consider a simple economy that produces two goods: pencils and erasers....
 5. Real versus nominal GDP Consider a simple economy that produces two goods: pencils and erasers. The following table shows the prices and quantities of the goods over a three-year period. Pencils Price Quantity (Dollars per pencil (Number of pencils) 1 125 Erasers Price Quantity (Dollars per eraser (Number of erasers) 1 200 Year 2018 2019 170 4 230 2020 4 150 4 170 Use the information from the preceding table to fill in the following table. Nominal GDP (Dollars)...
Consider a simple economy that produces two goods: apples and envelopes. The following table shows the prices and quantities of the goods over a three-year period.
 Consider a simple economy that produces two goods: apples and envelopes. The following table shows the prices and quantities of the goods over a three-year period. Use the information from the previous table to fill in the following table. From 2015 to 2016, nominal GDP _______, and real GDP _______.The inflation rate in 2016 was _______.Why is real GDP a more accurate measure of an economy's production than nominal GDP? Nominal GDP is adjusted for the effects of inflation or deflation, whereas real GDP...
- Work It Out • Consider an economy that produces and consumes hot dogs and hamburgers....
 - Work It Out • Consider an economy that produces and consumes hot dogs and hamburgers. In the following table are data for two different years. 2010 2018 Good Hot dogs Hamburgers Quantity 200 200 Price Quantity $2 250 $3 500 Price $4 $4 a. Using 2010 as the base year, compute the following statistics for each year: nominal GDP, real GDP, the implicit price deflator for GDP, and the CPI. b. By what percentage did prices rise between 2010...
 5. Real Versus homihal GDP Consider a simple economy that produces two goods: apples and muffins. The following table shows the prices and quantities of the goods over a three-year period. Apples Price Quantity (Dollars per apple) (Number of apples) Muffins Quantity (Dollars per muffin) (Number of muffins) Price 125 Year 2018 2019 2020 170 150 200 230 170 Use the information from the preceding table to fill in the following table. Nominal GDP (Dollars) Real GDP (Base year 2018,...
 1. Assume an economy that only produces pineapples, snorkels and umbrellas. With data from the table below, answer the following questions: Item Pineapples Snorkels Umbrellas Current Period Quantity Price 4,240 $1.30 5,000 $10.00 1,060 $100.00 Base Period Quantity Price 4,240 $1.00 5,000 S8.00 1,060 $100.00 a. Estimate nominal GDP for both periods b. Estimate real GDP for both periods utilizing prices from the base period c. Estimate the inflation rate for the current period utilizing the growth rates in nominal...
 5. Real versus nominal GDP Consider a simple economy that produces two goods: apples and muffins. The following table shows the prices and quantities of the goods over a three- year period. Apples Price Quantity (Dollars per apple) (Number of apples) Year 2018 2019 115 Muffins Price Quantity (Dollars per muffin) (Number of muffins) 175 180 160 150 2020 100 Use the information from the preceding table to fill in the following table. Nominal GDP (Dollars) Real GDP (Base year...
 5. Real versus nominal GDP Consider a simple economy that produces two goods: pencils and erasers. The following table shows the prices and quantities of the goods over a three-year period. Pencils Price Quantity (Dollars per pencil (Number of pencils) 1 125 Erasers Price Quantity (Dollars per eraser (Number of erasers) 1 200 Year 2018 2019 170 4 230 2020 4 150 4 170 Use the information from the preceding table to fill in the following table. Nominal GDP (Dollars)...
 - Work It Out • Consider an economy that produces and consumes hot dogs and hamburgers. In the following table are data for two different years. 2010 2018 Good Hot dogs Hamburgers Quantity 200 200 Price Quantity $2 250 $3 500 Price $4 $4 a. Using 2010 as the base year, compute the following statistics for each year: nominal GDP, real GDP, the implicit price deflator for GDP, and the CPI. b. By what percentage did prices rise between 2010...
Most questions answered within 3 hours.
-
A baseball batter hits a 0.145kg baseball straight up into the
air. The baseball leaves the...
asked 16 minutes ago -
An FM modulator is tested using
single-tone baseband signal with frequency of 50kHz and a sprectrum...
asked 36 minutes ago -
Write the ionic equations for the first stage of salts
hydrolysis.
Anion, Cation?
Na2S
NiSO4
K2SO4...
asked 2 hours ago -
suppose there is a normally distributed population with a mean of
250 and a standard deviation...
asked 2 hours ago -
Question Three
Suppose you as project manager are using the Waterfall
development methodology on a large...
asked 3 hours ago -
Which statement is not true about welfare in Canada?
A.Benefits typically vary based on one's ability...
asked 4 hours ago -
Please help me with FLOWCHART and UML diagram for class,
thank you!
#include <iostream>
#include <fstream>...
asked 5 hours ago -
3. Describe the “logic circuit” of the Lac operon. Which
proteins are bound or not to...
asked 5 hours ago -
Ayesha’s adjusted gross income is $60,000 in 2019. She donated a
piece of artwork with a...
asked 5 hours ago -
For Dijkstra’s shortest path algorithm:
a. Give the Big-O time for Dijkstra’s shortest path algorithm
and...
asked 5 hours ago -
Phosphorus violates the 'octet rule' in biological molecules,
forming more covalent bonds than expected based on...
asked 5 hours ago -
A 1.3 eV electron has a 10-4 probability of tunneling
through a 2.4 eV potential barrier....
asked 5 hours ago