
Homework Answers
Question (a)
The input signal is band limited at

So the maximum frequency present in the signal is

So


So to avoid aliasing the minimum sampling frequency in Hz should be

So the sampling frequency should be atleast 11 Hz
The sampling period used is

So the sampling frequency in Hz used is


Since this is greater than the minimum required sampling frequency of 11 Hz, there wont be aliasing
The digital frequency is

So  will become
So  will become

So  will become

So the sketch of the FT of the sampled signal will be

Question (b)
![x[n] (6) a[n] +4). u[-n - 1]](http://img.homeworklib.com/questions/e0ef6560-7fd2-11ec-94d3-e58d16bde97c.png?x-oss-process=image/resize,w_560)
The Z transform is given as
![Χ(2) = α[n]z-1 n=-00](http://img.homeworklib.com/questions/e1613540-7fd2-11ec-a0c1-53b811090db3.png?x-oss-process=image/resize,w_560)
![-2 Χ(2) = Σ (4) a[n] +() () -η - 1) -- n=-00](http://img.homeworklib.com/questions/e1bdfad0-7fd2-11ec-8f6d-4dce04a07b82.png?x-oss-process=image/resize,w_560)
![σα -2 Χ(2) = Σβ). u[n]z-1 + Σ4). u[-η - 1]z- n=-00 n=-00](http://img.homeworklib.com/questions/e2181d20-7fd2-11ec-adc4-31f244d34652.png?x-oss-process=image/resize,w_560)

![X,z) = Με u[n]z-n 2. n=- 00](http://img.homeworklib.com/questions/e2ddc5a0-7fd2-11ec-b964-79d6a26bce67.png?x-oss-process=image/resize,w_560)
![-72 Χ.(z) = Σ(4). u[-η - 1]z- η =-00](http://img.homeworklib.com/questions/e33a7230-7fd2-11ec-9058-d968c840ef20.png?x-oss-process=image/resize,w_560)
Let evaluate 
![X,z) = Με u[n]z-n 2. n=- 00](http://img.homeworklib.com/questions/e3f1d790-7fd2-11ec-9c57-85a442792174.png?x-oss-process=image/resize,w_560)
Using
![u] = {%, n>0 n<0](http://img.homeworklib.com/questions/e452f730-7fd2-11ec-b656-2583b0840604.png?x-oss-process=image/resize,w_560)
We get


Expanding we get

This is an infinite GP with common
ratio  . The sum of an
infinite GP is given as
. The sum of an
infinite GP is given as


This is valid only if
![Ir] <1](http://img.homeworklib.com/questions/e70f7010-7fd2-11ec-89aa-95c9caefac56.png?x-oss-process=image/resize,w_560)
So


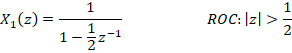
![n 1 X2) = ROC:[2] > 1 2 2](http://img.homeworklib.com/questions/e9004290-7fd2-11ec-9247-6f122f18b56f.png?x-oss-process=image/resize,w_560)
Now lets evaluate 
![-72 Χ.(z) = Σ(4). u[-η - 1]z- η =-00](http://img.homeworklib.com/questions/e9c464e0-7fd2-11ec-aeb0-9709e3c162f2.png?x-oss-process=image/resize,w_560)
Using
![u[-n- 1] = {0; -n-10 -n-1<0](http://img.homeworklib.com/questions/ea332840-7fd2-11ec-879c-c586aab55b87.png?x-oss-process=image/resize,w_560)
![u[-n- 1] = {d} -n > 1 -N <1](http://img.homeworklib.com/questions/ea948f90-7fd2-11ec-9ecb-63e3f45eb16f.png?x-oss-process=image/resize,w_560)
![u[-n- 1] = {d} n<-1 n> -1](http://img.homeworklib.com/questions/eaf8caf0-7fd2-11ec-a2b8-db4258030850.png?x-oss-process=image/resize,w_560)
We get


Expanding we get


The series in the bracket is an
infinite GP with common ratio  . The sum of an
infinite GP is given as
. The sum of an
infinite GP is given as


This is valid only if
![Ir] <1](http://img.homeworklib.com/questions/ee70da90-7fd2-11ec-81bf-e5a75fc6a9d9.png?x-oss-process=image/resize,w_560)
So


So the Z transform is

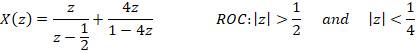
So we see that the ROC is not possible. So the Z transform does not exist
Add Answer to:
(a) The continuous-time signal x(t) with FT as depicted in the figure shown below is sampled....
Question 3: The continuous-time signal x(t) with FT as displayed below is sampled. X(jw) 1 107...
 Question 3: The continuous-time signal x(t) with FT as displayed below is sampled. X(jw) 1 107 -1079 Sketch the FT of the sampled signal for the following sampling periods (10 marks) (a) T, = 1/14 (b) T. = 1/10. (10 marks) (c) In each case, state whether we can recover the original signal x(t) or not. (10 marks
Problem 3: Sampling a Cosine (again) The continuous-time signal ra(t) = cos (150) is sampled with...
 Problem 3: Sampling a Cosine (again) The continuous-time signal ra(t) = cos (150) is sampled with sampling period T, to obtain a discrete-time signal x[n] = XanT). 1. Compute and sketch the magnitude of the continuous-time Fourier transform of ra(t) and the discrete-time Fourier Transform of x[n] for T, = 1 ms and T, = 2 ms. 2. What is the maximum sampling period Ts max such that no aliasing occurs in the sampling process?
Q. 2 A continuous time signal x(t) has the Continuous Time Fourier Transform shown in Fig...
 Q. 2 A continuous time signal x(t) has the Continuous Time Fourier Transform shown in Fig 2. Xc() -80007 0 80001 2 (rad/s) Fig 2 According to the sampling theorem, find the maximum allowable sampling period T for this signal. Also plot the Fourier Transforms of the sampled signal X:(j) and X(elo). Label the resulting signals appropriately (both in frequency and amplitude axis). Assuming that the sampling period is increased 1.2 times, what is the new sampling frequency 2? What...
3. The signal continuous time signal re(t)-cos(200t)2cos cos(100t) is sampled at twice the Nyquis...
 3. The signal continuous time signal re(t)-cos(200t)2cos cos(100t) is sampled at twice the Nyquist rate to get the sequence r[n]. (a) Sketch X(e) (b) If y[n] = [4n]. Sketch Y(e'"). (c) Is there any aliasing in the Fourier spectrum of yin]? Why or Why Not? (d) If z [n] = x-1, ketch the DTFT of z[n] (e) Is there any aliasing in the Fourier spectrum of [n]? Why or Why Not?
3. The signal continuous time signal re(t)-cos(200t)2cos cos(100t) is...
3. The signal continuous time signal re(t)-cos(200t)2cos cos(100t) is sampled at twice the Nyquist rate to get the sequence r[n]. (a) Sketch X(e) (b) If y[n] = [4n]. Sketch Y(e'"). (c) Is there any aliasing in the Fourier spectrum of yin]? Why or Why Not? (d) If z [n] = x-1, ketch the DTFT of z[n] (e) Is there any aliasing in the Fourier spectrum of [n]? Why or Why Not?
3. The signal continuous time signal re(t)-cos(200t)2cos cos(100t) is...
10. Find the Fourier transform of a continuous-time signal x(t) = 10e Su(t). Plot the magnitude...
 10. Find the Fourier transform of a continuous-time signal x(t) = 10e Su(t). Plot the magnitude spectrum and the phase spectrum. If the signal is going to be sampled, what should be the minimum sampling frequency so that the aliasing error is less than 0.1 % of the maximum original magnitude at half the sampling frequency. 11. A signal x(t) = 5cos(2nt + 1/6) is sampled at every 0.2 seconds. Find the sequence obtained over the interval 0 st 3...
# 1 : Imagine that you have a continuous-time signal x(t) whose continuous-time Fourier transform is...
 # 1 : Imagine that you have a continuous-time signal x(t) whose continuous-time Fourier transform is as given below -25 -20 f, Hz -10 10 20 25 (a) (10 pts) Imagine that this signal is sampled at the sampling rate of F, 65 Hz. Sketch the FT of the resulting signal that would be at the output of an ideal DAC (like we discussed in class) when given these samples. (b) (10 pts) Repeat part (a) for the case that...
Q2.) Consider the sampling of the continuous-time signal x(t) to obtain a discrete-time signal x[...
 Q2.) Consider the sampling of the continuous-time signal x(t) to obtain a discrete-time signal x[n (1)-10cos(1000m + π/3) + 20cos(2000m + π/6). 110points! ], where x a) What is the maximum sampling interval (minimum sampling frequency) that could be used to ensure an aliasing free sampling of this signal? b) Plot the spectrum of the sampled signal if x() is sampled using a sampling frequency of (i) 2500 Hz (ii) 1800 Hz and state whether there will be an aliasing...
Don't need to do #1. Please go into detail on how you solved #2 and #3 The Fourier transform of the signal r(t) is given by the following figure (X(jw)0 for w> 20) X(ju) 0.8 0.6 0.4 0.2 -10 10...
 Don't need to do #1. Please go into detail on how you solved #2
and #3
The Fourier transform of the signal r(t) is given by the following figure (X(jw)0 for w> 20) X(ju) 0.8 0.6 0.4 0.2 -10 10 20 m Page 4 of 5 Final S09 EE315 Signals & Systems The signal is sampled to obtain the signal withFourier transform Xlw 1. (5p) What is the minimum sampling frequency w 2. (10p) Now suppose that the sampling frequency...
Don't need to do #1. Please go into detail on how you solved #2
and #3
The Fourier transform of the signal r(t) is given by the following figure (X(jw)0 for w> 20) X(ju) 0.8 0.6 0.4 0.2 -10 10 20 m Page 4 of 5 Final S09 EE315 Signals & Systems The signal is sampled to obtain the signal withFourier transform Xlw 1. (5p) What is the minimum sampling frequency w 2. (10p) Now suppose that the sampling frequency...
An analog signal is given as below x(t) = 10sin 4rtt The signal is sampled by...
 An analog signal is given as below x(t) = 10sin 4rtt The signal is sampled by two different frequencies f, = 1Hz, f, = 10Hz respectively, and the output are yı, Yz. (i) Sketch signal x(t) in the time domain. (3 marks) (ii) Sketch frequency spectrum of x(t). (3 marks) (iii) After sampling, the continuous signal is converted to a discrete signal. Draw the two discrete signals Yı, Y2: (4 marks) (iv) Discuss whether f1, f, can successfully sample the...
10ρ 18ρ A signal (t) has the Fourier transform X(jw) indicated in the figure. The signal is sampled to obtain the discrete time signal 1. Sketch the Fourier transform Xr(jw) of x[n] for T-to. 2. Can...
 10ρ 18ρ A signal (t) has the Fourier transform X(jw) indicated in the figure. The signal is sampled to obtain the discrete time signal 1. Sketch the Fourier transform Xr(jw) of x[n] for T-to. 2. Can x(t) be recovered for T? How? What is the maximum value of T so that r(t) can be recovered?
10ρ 18ρ A signal (t) has the Fourier transform X(jw) indicated in the figure. The signal is sampled to obtain the discrete time signal 1....
10ρ 18ρ A signal (t) has the Fourier transform X(jw) indicated in the figure. The signal is sampled to obtain the discrete time signal 1. Sketch the Fourier transform Xr(jw) of x[n] for T-to. 2. Can x(t) be recovered for T? How? What is the maximum value of T so that r(t) can be recovered?
10ρ 18ρ A signal (t) has the Fourier transform X(jw) indicated in the figure. The signal is sampled to obtain the discrete time signal 1....
 Question 3: The continuous-time signal x(t) with FT as displayed below is sampled. X(jw) 1 107 -1079 Sketch the FT of the sampled signal for the following sampling periods (10 marks) (a) T, = 1/14 (b) T. = 1/10. (10 marks) (c) In each case, state whether we can recover the original signal x(t) or not. (10 marks
 Problem 3: Sampling a Cosine (again) The continuous-time signal ra(t) = cos (150) is sampled with sampling period T, to obtain a discrete-time signal x[n] = XanT). 1. Compute and sketch the magnitude of the continuous-time Fourier transform of ra(t) and the discrete-time Fourier Transform of x[n] for T, = 1 ms and T, = 2 ms. 2. What is the maximum sampling period Ts max such that no aliasing occurs in the sampling process?
 Q. 2 A continuous time signal x(t) has the Continuous Time Fourier Transform shown in Fig 2. Xc() -80007 0 80001 2 (rad/s) Fig 2 According to the sampling theorem, find the maximum allowable sampling period T for this signal. Also plot the Fourier Transforms of the sampled signal X:(j) and X(elo). Label the resulting signals appropriately (both in frequency and amplitude axis). Assuming that the sampling period is increased 1.2 times, what is the new sampling frequency 2? What...
 3. The signal continuous time signal re(t)-cos(200t)2cos cos(100t) is sampled at twice the Nyquist rate to get the sequence r[n]. (a) Sketch X(e) (b) If y[n] = [4n]. Sketch Y(e'"). (c) Is there any aliasing in the Fourier spectrum of yin]? Why or Why Not? (d) If z [n] = x-1, ketch the DTFT of z[n] (e) Is there any aliasing in the Fourier spectrum of [n]? Why or Why Not?
3. The signal continuous time signal re(t)-cos(200t)2cos cos(100t) is...
3. The signal continuous time signal re(t)-cos(200t)2cos cos(100t) is sampled at twice the Nyquist rate to get the sequence r[n]. (a) Sketch X(e) (b) If y[n] = [4n]. Sketch Y(e'"). (c) Is there any aliasing in the Fourier spectrum of yin]? Why or Why Not? (d) If z [n] = x-1, ketch the DTFT of z[n] (e) Is there any aliasing in the Fourier spectrum of [n]? Why or Why Not?
3. The signal continuous time signal re(t)-cos(200t)2cos cos(100t) is...
 10. Find the Fourier transform of a continuous-time signal x(t) = 10e Su(t). Plot the magnitude spectrum and the phase spectrum. If the signal is going to be sampled, what should be the minimum sampling frequency so that the aliasing error is less than 0.1 % of the maximum original magnitude at half the sampling frequency. 11. A signal x(t) = 5cos(2nt + 1/6) is sampled at every 0.2 seconds. Find the sequence obtained over the interval 0 st 3...
 # 1 : Imagine that you have a continuous-time signal x(t) whose continuous-time Fourier transform is as given below -25 -20 f, Hz -10 10 20 25 (a) (10 pts) Imagine that this signal is sampled at the sampling rate of F, 65 Hz. Sketch the FT of the resulting signal that would be at the output of an ideal DAC (like we discussed in class) when given these samples. (b) (10 pts) Repeat part (a) for the case that...
 Q2.) Consider the sampling of the continuous-time signal x(t) to obtain a discrete-time signal x[n (1)-10cos(1000m + π/3) + 20cos(2000m + π/6). 110points! ], where x a) What is the maximum sampling interval (minimum sampling frequency) that could be used to ensure an aliasing free sampling of this signal? b) Plot the spectrum of the sampled signal if x() is sampled using a sampling frequency of (i) 2500 Hz (ii) 1800 Hz and state whether there will be an aliasing...
 Don't need to do #1. Please go into detail on how you solved #2
and #3
The Fourier transform of the signal r(t) is given by the following figure (X(jw)0 for w> 20) X(ju) 0.8 0.6 0.4 0.2 -10 10 20 m Page 4 of 5 Final S09 EE315 Signals & Systems The signal is sampled to obtain the signal withFourier transform Xlw 1. (5p) What is the minimum sampling frequency w 2. (10p) Now suppose that the sampling frequency...
Don't need to do #1. Please go into detail on how you solved #2
and #3
The Fourier transform of the signal r(t) is given by the following figure (X(jw)0 for w> 20) X(ju) 0.8 0.6 0.4 0.2 -10 10 20 m Page 4 of 5 Final S09 EE315 Signals & Systems The signal is sampled to obtain the signal withFourier transform Xlw 1. (5p) What is the minimum sampling frequency w 2. (10p) Now suppose that the sampling frequency...
 An analog signal is given as below x(t) = 10sin 4rtt The signal is sampled by two different frequencies f, = 1Hz, f, = 10Hz respectively, and the output are yı, Yz. (i) Sketch signal x(t) in the time domain. (3 marks) (ii) Sketch frequency spectrum of x(t). (3 marks) (iii) After sampling, the continuous signal is converted to a discrete signal. Draw the two discrete signals Yı, Y2: (4 marks) (iv) Discuss whether f1, f, can successfully sample the...
 10ρ 18ρ A signal (t) has the Fourier transform X(jw) indicated in the figure. The signal is sampled to obtain the discrete time signal 1. Sketch the Fourier transform Xr(jw) of x[n] for T-to. 2. Can x(t) be recovered for T? How? What is the maximum value of T so that r(t) can be recovered?
10ρ 18ρ A signal (t) has the Fourier transform X(jw) indicated in the figure. The signal is sampled to obtain the discrete time signal 1....
10ρ 18ρ A signal (t) has the Fourier transform X(jw) indicated in the figure. The signal is sampled to obtain the discrete time signal 1. Sketch the Fourier transform Xr(jw) of x[n] for T-to. 2. Can x(t) be recovered for T? How? What is the maximum value of T so that r(t) can be recovered?
10ρ 18ρ A signal (t) has the Fourier transform X(jw) indicated in the figure. The signal is sampled to obtain the discrete time signal 1....
Most questions answered within 3 hours.
-
3) What are the typical social structures in a global city?
asked 2 hours ago -
Luther Corporation
Consolidated Balance Sheet
December 31, 2019 and 2018 (in $ millions)
Assets
2019
2018...
asked 2 hours ago -
(Expected rate of return and risk) Carter Inc. is evaluating a
security. Calculate the investment’s expected...
asked 5 hours ago -
What specific indicators can point to lack of progress for
African Americans in American society?
asked 6 hours ago -
1-The Electrons in a beam are moving at 2.7×10⁸ m/s in an
electric field of 15000...
asked 6 hours ago -
A gas tank is a vertical cylinder. It has a radius of 1m, a
height of...
asked 7 hours ago -
Accent Software faces the following conditions. All of these
support Accent’s use of a market-penetration pricing...
asked 8 hours ago -
A mathematically inclined friend emails you the following
instructions: "Meet me in the cafeteria the first...
asked 8 hours ago -
A monopoly sells in two countries . The demand curves in the two
countries are p1...
asked 9 hours ago -
A .15kg rubber ball is bounced off a wall. Before hitting the
wall, the ball moves...
asked 9 hours ago -
A manufacturing company preparing to build a new plant is
considering three potential locations for it....
asked 9 hours ago -
B. If compound Y has approximately the same values of solubility
in toluene as compound X,...
asked 10 hours ago