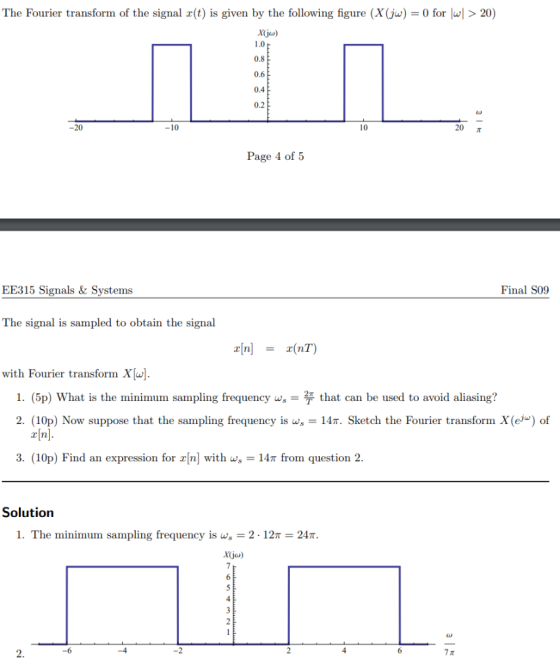
Don't need to do #1. Please go into detail on how you solved #2 and #3
Homework Answers

Add Answer to:
Don't need to do #1. Please go into detail on how you solved #2 and #3 The Fourier transform of the signal r(t) is given by the following figure (X(jw)0 for w> 20) X(ju) 0.8 0.6 0.4 0.2 -10 10...
4. The continuous-time signal e(t) has the Fourier transform X(jw) shown below. Xe(ju) is zero ou...
 4. The continuous-time signal e(t) has the Fourier transform X(jw) shown below. Xe(ju) is zero outside the region shown in the figure X.Gj) -2T (300) -2r(100) 0 2n(100) 2T (300) We need to filter re(t) to remove all frequencies higher than 200 Hz. (a) Plot the effective continuous-time filter we need to implement. Label your plot. b) Suppose we decide to implement the filtering in discrete-time using the overall process (sample, filter, reconstruct) shown in the figure in Problem 3....
10. Find the Fourier transform of a continuous-time signal x(t) = 10e Su(t). Plot the magnitude...
 10. Find the Fourier transform of a continuous-time signal x(t) = 10e Su(t). Plot the magnitude spectrum and the phase spectrum. If the signal is going to be sampled, what should be the minimum sampling frequency so that the aliasing error is less than 0.1 % of the maximum original magnitude at half the sampling frequency. 11. A signal x(t) = 5cos(2nt + 1/6) is sampled at every 0.2 seconds. Find the sequence obtained over the interval 0 st 3...
Q. 2 A continuous time signal x(t) has the Continuous Time Fourier Transform shown in Fig...
 Q. 2 A continuous time signal x(t) has the Continuous Time Fourier Transform shown in Fig 2. Xc() -80007 0 80001 2 (rad/s) Fig 2 According to the sampling theorem, find the maximum allowable sampling period T for this signal. Also plot the Fourier Transforms of the sampled signal X:(j) and X(elo). Label the resulting signals appropriately (both in frequency and amplitude axis). Assuming that the sampling period is increased 1.2 times, what is the new sampling frequency 2? What...
(b) Let X(ju) denote the Fourier transform of the signal r(t) shown in the figure x(t) 2 -2 1 2 Using the properties of the Fourier transform (and without explicitly evaluating X(jw)), ii. (5 pts)...
 (b) Let X(ju) denote the Fourier transform of the signal r(t) shown in the figure x(t) 2 -2 1 2 Using the properties of the Fourier transform (and without explicitly evaluating X(jw)), ii. (5 pts) Find2X(jw)dw. Hint: Apply the definition of the inverse Fourier transform formula, and you can also recall the time shift property for Fourier Transform. (c) (5 pts) Fourier Series. Consider the periodic signal r(t) below: 1 x(t) 1 -2 ·1/4 Transform r(t) into its Fourier Series...
10ρ 18ρ A signal (t) has the Fourier transform X(jw) indicated in the figure. The signal is sampled to obtain the discrete time signal 1. Sketch the Fourier transform Xr(jw) of x[n] for T-to. 2. Can...
 10ρ 18ρ A signal (t) has the Fourier transform X(jw) indicated in the figure. The signal is sampled to obtain the discrete time signal 1. Sketch the Fourier transform Xr(jw) of x[n] for T-to. 2. Can x(t) be recovered for T? How? What is the maximum value of T so that r(t) can be recovered?
10ρ 18ρ A signal (t) has the Fourier transform X(jw) indicated in the figure. The signal is sampled to obtain the discrete time signal 1....
10ρ 18ρ A signal (t) has the Fourier transform X(jw) indicated in the figure. The signal is sampled to obtain the discrete time signal 1. Sketch the Fourier transform Xr(jw) of x[n] for T-to. 2. Can x(t) be recovered for T? How? What is the maximum value of T so that r(t) can be recovered?
10ρ 18ρ A signal (t) has the Fourier transform X(jw) indicated in the figure. The signal is sampled to obtain the discrete time signal 1....
MATLAB Fourier transform. Suppose that a signal x(t) is sampled with sampling frequency fs =100Hz. The sequence x[n] obtained after the sampling is given below: Take the DFT of the sampled sequence a...
 MATLAB Fourier transform. Suppose that a signal x(t) is sampled
with sampling frequency fs =100Hz.
The sequence x[n] obtained after the sampling is given below:
Take the DFT of the sampled sequence and plot
its magnitude and phase.
What is the frequency resolution (Δf) of your plot?
N= 20, 100 Hz
N= 20, 100 Hz
MATLAB Fourier transform. Suppose that a signal x(t) is sampled
with sampling frequency fs =100Hz.
The sequence x[n] obtained after the sampling is given below:
Take the DFT of the sampled sequence and plot
its magnitude and phase.
What is the frequency resolution (Δf) of your plot?
N= 20, 100 Hz
N= 20, 100 Hz
Suppose that r(l) is a band-limited signal with the bandwidth W. Suppose that we sampled this...
 Suppose that r(l) is a band-limited signal with the bandwidth W. Suppose that we sampled this signal with the sainpling interval T, to generate the sample sequence 1 TLI suppose that 2n/T is larger than the Nyquist rate 2W Given rn, we reconstructed a conius time signal ( using the zero-order-hold method. In other words, rr(l) n for L E [nT, (n +1)T;). In the last lecture, we derived that where s(), as usual, denotes the continuous time representation of...
4. Using Matlab: 4.1. Plot | H(n the following cases: (the frequency range: 0-20 KHz) a. a 0.2 0.5 ms. b. α-0.8 C.α-0.2 c-0.1 ms. c 0.5 ms. 4.2. Consider a signal whose Fourier Transform is given...
 4. Using Matlab: 4.1. Plot | H(n the following cases: (the frequency range: 0-20 KHz) a. a 0.2 0.5 ms. b. α-0.8 C.α-0.2 c-0.1 ms. c 0.5 ms. 4.2. Consider a signal whose Fourier Transform is given by: 50000ω Plot the transfer function l x(o) l and the output l Y(o) l in each of the above cases (stated in part 4.1) 4.3. Find the Inverse Fourier Transorms of| X(oand Y(o) , and generate the audio signals x and y...
 4. The continuous-time signal e(t) has the Fourier transform X(jw) shown below. Xe(ju) is zero outside the region shown in the figure X.Gj) -2T (300) -2r(100) 0 2n(100) 2T (300) We need to filter re(t) to remove all frequencies higher than 200 Hz. (a) Plot the effective continuous-time filter we need to implement. Label your plot. b) Suppose we decide to implement the filtering in discrete-time using the overall process (sample, filter, reconstruct) shown in the figure in Problem 3....
 10. Find the Fourier transform of a continuous-time signal x(t) = 10e Su(t). Plot the magnitude spectrum and the phase spectrum. If the signal is going to be sampled, what should be the minimum sampling frequency so that the aliasing error is less than 0.1 % of the maximum original magnitude at half the sampling frequency. 11. A signal x(t) = 5cos(2nt + 1/6) is sampled at every 0.2 seconds. Find the sequence obtained over the interval 0 st 3...
 Q. 2 A continuous time signal x(t) has the Continuous Time Fourier Transform shown in Fig 2. Xc() -80007 0 80001 2 (rad/s) Fig 2 According to the sampling theorem, find the maximum allowable sampling period T for this signal. Also plot the Fourier Transforms of the sampled signal X:(j) and X(elo). Label the resulting signals appropriately (both in frequency and amplitude axis). Assuming that the sampling period is increased 1.2 times, what is the new sampling frequency 2? What...
 (b) Let X(ju) denote the Fourier transform of the signal r(t) shown in the figure x(t) 2 -2 1 2 Using the properties of the Fourier transform (and without explicitly evaluating X(jw)), ii. (5 pts) Find2X(jw)dw. Hint: Apply the definition of the inverse Fourier transform formula, and you can also recall the time shift property for Fourier Transform. (c) (5 pts) Fourier Series. Consider the periodic signal r(t) below: 1 x(t) 1 -2 ·1/4 Transform r(t) into its Fourier Series...
 10ρ 18ρ A signal (t) has the Fourier transform X(jw) indicated in the figure. The signal is sampled to obtain the discrete time signal 1. Sketch the Fourier transform Xr(jw) of x[n] for T-to. 2. Can x(t) be recovered for T? How? What is the maximum value of T so that r(t) can be recovered?
10ρ 18ρ A signal (t) has the Fourier transform X(jw) indicated in the figure. The signal is sampled to obtain the discrete time signal 1....
10ρ 18ρ A signal (t) has the Fourier transform X(jw) indicated in the figure. The signal is sampled to obtain the discrete time signal 1. Sketch the Fourier transform Xr(jw) of x[n] for T-to. 2. Can x(t) be recovered for T? How? What is the maximum value of T so that r(t) can be recovered?
10ρ 18ρ A signal (t) has the Fourier transform X(jw) indicated in the figure. The signal is sampled to obtain the discrete time signal 1....
 MATLAB Fourier transform. Suppose that a signal x(t) is sampled
with sampling frequency fs =100Hz.
The sequence x[n] obtained after the sampling is given below:
Take the DFT of the sampled sequence and plot
its magnitude and phase.
What is the frequency resolution (Δf) of your plot?
N= 20, 100 Hz
N= 20, 100 Hz
MATLAB Fourier transform. Suppose that a signal x(t) is sampled
with sampling frequency fs =100Hz.
The sequence x[n] obtained after the sampling is given below:
Take the DFT of the sampled sequence and plot
its magnitude and phase.
What is the frequency resolution (Δf) of your plot?
N= 20, 100 Hz
N= 20, 100 Hz
 Suppose that r(l) is a band-limited signal with the bandwidth W. Suppose that we sampled this signal with the sainpling interval T, to generate the sample sequence 1 TLI suppose that 2n/T is larger than the Nyquist rate 2W Given rn, we reconstructed a conius time signal ( using the zero-order-hold method. In other words, rr(l) n for L E [nT, (n +1)T;). In the last lecture, we derived that where s(), as usual, denotes the continuous time representation of...
 4. Using Matlab: 4.1. Plot | H(n the following cases: (the frequency range: 0-20 KHz) a. a 0.2 0.5 ms. b. α-0.8 C.α-0.2 c-0.1 ms. c 0.5 ms. 4.2. Consider a signal whose Fourier Transform is given by: 50000ω Plot the transfer function l x(o) l and the output l Y(o) l in each of the above cases (stated in part 4.1) 4.3. Find the Inverse Fourier Transorms of| X(oand Y(o) , and generate the audio signals x and y...
Most questions answered within 3 hours.
-
A stone is projected vertically upwards at 20 m/s.
a. What is the total time of...
asked 7 minutes ago -
Define a function named how_many_substr_of_string(...) which
receives two parameters, the first parameters is a list with...
asked 2 minutes ago -
Calculate the following binomial probability by either using one
of the binomial probability tables, software, or...
asked 2 minutes ago -
A small asteroid (mass of 150 g ) strikes a glancing blow at a
satellite in...
asked 17 minutes ago -
Suppose that the firm has a minimum quantity of employment,
N*, that is, the firm can...
asked 3 minutes ago -
A delivery car had a first cost of $30,000, an annual operating
cost of $14,000, and...
asked 9 minutes ago -
Answer the following True/False questions:
T F Pruning a model will generally improve the model’s accuracy...
asked 15 minutes ago -
A bus is scheduled to arrive at the bus stop every morning at
8:00 A.M; however,...
asked 9 minutes ago -
PLEASE WRITE A CRITICAL COMMENT TO THIS ESSAY IN ABOUT 150
WORDS. tHANK YOU!
Before talking...
asked 16 minutes ago -
Order-getting costs would NOT include
a. marketing costs.
b. salaries of sales personnel.
c. customer service...
asked 19 minutes ago -
7. Write the AVL tree code and insert the above numbers. Show
the screen shot of...
asked 23 minutes ago -
Draw two aspartate side chains and how they hydrogen bond to
eachother
asked 31 minutes ago