
Homework Answers
Because
Given data Approximately normal and Left skewed
so mean is less than the median
Mean 
Add Answer to:
Use the properties of the mean and median to determine which are the correct mean and...
ribution by taking a transformation of the data. For the data shown below, take the natural...
 ribution by taking a transformation of the data. For the data shown below, take the natural logarithm of the data and answer the following questions 79725, 12862, 18022, 76712, 256440, 14013, 46083, 6808, 85781, 1251 6081, 50397, 11020, 13633, 1064, 496433, 25308, 6616, 11210, 13900 (a) Determine the mean, median, and standard deviation. median (b) Find the 25th, 50th, and 75th percentiles. 25th (c) Plot the data in a boxplot. 14 16 12 14 MacBook Air Plot the data in...
a football coach asks the playe < 1 2. 3 5 6 13 16 Question 7...
 a football coach asks the playe
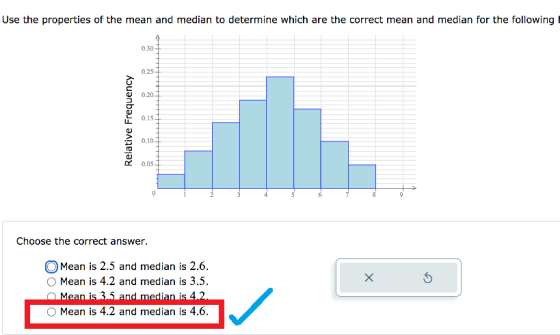
< 1 2. 3 5 6 13 16 Question 7 of 16 point) Attempt 1 of 1 | o 1h 10m Remaining 3.1 Section Exercise 25-28 Use the properties of the mean and median to determine which are the correct mean and median for the following histogram. ole 30- 025 20 Relative Frequency 15 6.10 0.05 Choose the correct answer. Mean is 4.1 and median is 4.2. Mean is 2.1 and median is 3.2....
a football coach asks the playe
< 1 2. 3 5 6 13 16 Question 7 of 16 point) Attempt 1 of 1 | o 1h 10m Remaining 3.1 Section Exercise 25-28 Use the properties of the mean and median to determine which are the correct mean and median for the following histogram. ole 30- 025 20 Relative Frequency 15 6.10 0.05 Choose the correct answer. Mean is 4.1 and median is 4.2. Mean is 2.1 and median is 3.2....
2.2.33 Question Help Use the relative frequency table shown to the right to calculate the number...
 2.2.33 Question Help Use the relative frequency table shown to the right to calculate the number of the 600 measurements falling into each of the measurement classes. Then graph a frequency histogram for these data Measurement Class 2.5-4.5 4.5-6.5 6.5-8.5 8.5-10.5 10.5-12.5 12.5-14.5 14.5-16.5 Relative Frequency 0.10 0.10 0.05 0.10 0.25 0.20 0.15 0.05 Calculate the number of measurements that fall into each class Measurement Class Frequen 0.5-2.5
Suppose that a survey is taken of a sample of Portuguese parents with at least one...
 Suppose that a survey is taken of a sample of Portuguese parents with at least one child under the age of 20 living at home. The parents are asked to report the number of days per week, X, in which they have family dinner at home. Identify which of the tables are valid probability models for X. X 0 1 2 3 4 5 6 7 P(X) -0.20 0.15 0.15 0.15 0.15 0.15 0.15 0.15 X 0 2 3 4...
please see instruction in pictures 3) Calculations: to be completed on one side of engineering paper must be neat and must include: a) Drawn to scale, a cross section of your member- inclu...
 please see instruction in pictures
3) Calculations: to be completed on one side of engineering paper must be neat and must include: a) Drawn to scale, a cross section of your member- include all dimensions for your case Hand calculations of Area, A, (in), Location of the Centroid, ỹ, (X-X), Moment of inertia, l (in*), Section Modulus, S Using bottom center of the given cross section as an origin, list all the coordinates in tabular form for the critical intersections...
please see instruction in pictures
3) Calculations: to be completed on one side of engineering paper must be neat and must include: a) Drawn to scale, a cross section of your member- include all dimensions for your case Hand calculations of Area, A, (in), Location of the Centroid, ỹ, (X-X), Moment of inertia, l (in*), Section Modulus, S Using bottom center of the given cross section as an origin, list all the coordinates in tabular form for the critical intersections...
Advanced-Math
2. Susan Winslow has two alternative routes to travel from her home in Olport to her office in Lewisburg. She can travel on Freeway 5 to Freeway 57 or on Freeway 55 to Freeway 91. The time distributions are as follows:Freeway 5Freeway 57Freeway 55Freeway 91RelativeRelativeRelativeRelativeTimeFrequencyTimeFrequencyTimeFrequencyTimeFrequency50.3040.1060.2030.3060.2050.2070.2040.3570.4060.3580.4050.2080.1070.2090.2060.1580.15Do a five-day simulation of each of the two combinations of routes using the random numbers below. Based on this simulation, which routes should Susan take if her objective is to minimize her total travel time?Freeway...
QUESTION 1 a) Consider the data of Table 1.1 which specifies the "life" of 40 similar...
 QUESTION 1 a) Consider the data of Table 1.1 which specifies the "life" of 40 similar car batteries recorded to the nearest tenth of a year. The batteries are guaranteed to last 3 years. Table 1.1 3.5 2.2 3.4 2.5 3.3 4.1 1.6 4.3 3.1 3.8 3.1 3.4 3.7 3.4 4.5 3.3 3.6 4.4 2.6 3.2 3.8 2.9 3.2 3.9 3.7 3.1 3.3 4.1 3.0 3.0 4.7 3.9 1.9 4.2 2.6 3.7 3.1 3.4 3.5 4.7 (i) Represent the above...
R Take Test: Hw1 Probability an x Find The Median For The Giver x+ ← →...
 R Take Test: Hw1 Probability an x Find The Median For The Giver x+ ← → С 을 https://elearning.uaeu.ac.ae/webapps/assessment/takelaunch.jsp?course assessment id--79759 1&courseid- 115789 18content id_-2265405_1&step-null ☆ y Question Completion Status: QUESTION 5 1 points Save Answer A nurse measured the blood pressure of each person who visited her clinic. Following is a relative-frequency histogram for the systolic blood pressure readings for those people aged between 25 and 40. Use the histogram to answer the question. The blood pressure readings were...
Question 2 of 5 (1 point) Attempt 1 of 1 | 1h 2m Remaining 3.1 Section...
 Question 2 of 5 (1 point) Attempt 1 of 1 | 1h 2m Remaining 3.1 Section Exercise 2 Use the properties of the mean and median to determine which are the correct mean and median for the following histogram. 0.25 3 010 Choose the correct answer. Mean is 5.9 and median is 6.3 Mean is 6.1 and median is 5.1 Mean is 4.6 and median is 6.1 Mean is 2.3 and median is 2.1. SONY
just need help with these two questions please Find the specified probability. 17) Use the special...
 just need help with these two questions please
Find the specified probability. 17) Use the special addition rule and the following probability distribution to determine P(6 < X 8) 5 6 8 9 10 11 P(X = x) 0.05 0.05 0.20 0.15 0.15 0.10 0.30 х 7 3) Solve the problem. 3) A southeastern college has an enrollment of 2951 female students. Records show that the mean height of these students is 64.7 inches and that the standard deviation is...
just need help with these two questions please
Find the specified probability. 17) Use the special addition rule and the following probability distribution to determine P(6 < X 8) 5 6 8 9 10 11 P(X = x) 0.05 0.05 0.20 0.15 0.15 0.10 0.30 х 7 3) Solve the problem. 3) A southeastern college has an enrollment of 2951 female students. Records show that the mean height of these students is 64.7 inches and that the standard deviation is...
 ribution by taking a transformation of the data. For the data shown below, take the natural logarithm of the data and answer the following questions 79725, 12862, 18022, 76712, 256440, 14013, 46083, 6808, 85781, 1251 6081, 50397, 11020, 13633, 1064, 496433, 25308, 6616, 11210, 13900 (a) Determine the mean, median, and standard deviation. median (b) Find the 25th, 50th, and 75th percentiles. 25th (c) Plot the data in a boxplot. 14 16 12 14 MacBook Air Plot the data in...
 a football coach asks the playe
< 1 2. 3 5 6 13 16 Question 7 of 16 point) Attempt 1 of 1 | o 1h 10m Remaining 3.1 Section Exercise 25-28 Use the properties of the mean and median to determine which are the correct mean and median for the following histogram. ole 30- 025 20 Relative Frequency 15 6.10 0.05 Choose the correct answer. Mean is 4.1 and median is 4.2. Mean is 2.1 and median is 3.2....
a football coach asks the playe
< 1 2. 3 5 6 13 16 Question 7 of 16 point) Attempt 1 of 1 | o 1h 10m Remaining 3.1 Section Exercise 25-28 Use the properties of the mean and median to determine which are the correct mean and median for the following histogram. ole 30- 025 20 Relative Frequency 15 6.10 0.05 Choose the correct answer. Mean is 4.1 and median is 4.2. Mean is 2.1 and median is 3.2....
 2.2.33 Question Help Use the relative frequency table shown to the right to calculate the number of the 600 measurements falling into each of the measurement classes. Then graph a frequency histogram for these data Measurement Class 2.5-4.5 4.5-6.5 6.5-8.5 8.5-10.5 10.5-12.5 12.5-14.5 14.5-16.5 Relative Frequency 0.10 0.10 0.05 0.10 0.25 0.20 0.15 0.05 Calculate the number of measurements that fall into each class Measurement Class Frequen 0.5-2.5
 Suppose that a survey is taken of a sample of Portuguese parents with at least one child under the age of 20 living at home. The parents are asked to report the number of days per week, X, in which they have family dinner at home. Identify which of the tables are valid probability models for X. X 0 1 2 3 4 5 6 7 P(X) -0.20 0.15 0.15 0.15 0.15 0.15 0.15 0.15 X 0 2 3 4...
 please see instruction in pictures
3) Calculations: to be completed on one side of engineering paper must be neat and must include: a) Drawn to scale, a cross section of your member- include all dimensions for your case Hand calculations of Area, A, (in), Location of the Centroid, ỹ, (X-X), Moment of inertia, l (in*), Section Modulus, S Using bottom center of the given cross section as an origin, list all the coordinates in tabular form for the critical intersections...
please see instruction in pictures
3) Calculations: to be completed on one side of engineering paper must be neat and must include: a) Drawn to scale, a cross section of your member- include all dimensions for your case Hand calculations of Area, A, (in), Location of the Centroid, ỹ, (X-X), Moment of inertia, l (in*), Section Modulus, S Using bottom center of the given cross section as an origin, list all the coordinates in tabular form for the critical intersections...
 QUESTION 1 a) Consider the data of Table 1.1 which specifies the "life" of 40 similar car batteries recorded to the nearest tenth of a year. The batteries are guaranteed to last 3 years. Table 1.1 3.5 2.2 3.4 2.5 3.3 4.1 1.6 4.3 3.1 3.8 3.1 3.4 3.7 3.4 4.5 3.3 3.6 4.4 2.6 3.2 3.8 2.9 3.2 3.9 3.7 3.1 3.3 4.1 3.0 3.0 4.7 3.9 1.9 4.2 2.6 3.7 3.1 3.4 3.5 4.7 (i) Represent the above...
 R Take Test: Hw1 Probability an x Find The Median For The Giver x+ ← → С 을 https://elearning.uaeu.ac.ae/webapps/assessment/takelaunch.jsp?course assessment id--79759 1&courseid- 115789 18content id_-2265405_1&step-null ☆ y Question Completion Status: QUESTION 5 1 points Save Answer A nurse measured the blood pressure of each person who visited her clinic. Following is a relative-frequency histogram for the systolic blood pressure readings for those people aged between 25 and 40. Use the histogram to answer the question. The blood pressure readings were...
 Question 2 of 5 (1 point) Attempt 1 of 1 | 1h 2m Remaining 3.1 Section Exercise 2 Use the properties of the mean and median to determine which are the correct mean and median for the following histogram. 0.25 3 010 Choose the correct answer. Mean is 5.9 and median is 6.3 Mean is 6.1 and median is 5.1 Mean is 4.6 and median is 6.1 Mean is 2.3 and median is 2.1. SONY
 just need help with these two questions please
Find the specified probability. 17) Use the special addition rule and the following probability distribution to determine P(6 < X 8) 5 6 8 9 10 11 P(X = x) 0.05 0.05 0.20 0.15 0.15 0.10 0.30 х 7 3) Solve the problem. 3) A southeastern college has an enrollment of 2951 female students. Records show that the mean height of these students is 64.7 inches and that the standard deviation is...
just need help with these two questions please
Find the specified probability. 17) Use the special addition rule and the following probability distribution to determine P(6 < X 8) 5 6 8 9 10 11 P(X = x) 0.05 0.05 0.20 0.15 0.15 0.10 0.30 х 7 3) Solve the problem. 3) A southeastern college has an enrollment of 2951 female students. Records show that the mean height of these students is 64.7 inches and that the standard deviation is...
Most questions answered within 3 hours.
-
Consider the competitive environment of Starbuck's, Progressive
Insurance, a manufacturing firm with low turnover, or a...
asked 30 minutes ago -
3. Gains from trade
Consider two neighbouring island countries called Euphoria and
Contente. They each have...
asked 2 hours ago -
A business executive has the option to invest money in two
plans: Plan A guarantees that...
asked 4 hours ago -
Hello, can someone please help me answer this question?
How much heat is absorbed by a...
asked 4 hours ago -
. A marketing researcher conducted a survey of 25 shoppers
randomly selected at the local mall...
asked 4 hours ago -
Create an comprehensive response to the
following:
Antimicrobial agents work on a multitude of microbes (bacteria,...
asked 5 hours ago -
6.13 LAB: Step counter. Section 6.3.
A pedometer treats walking 2,000 steps as walking 1 mile....
asked 4 hours ago -
(14.2) A block of mass m = 10 kg riding on a frictionless
horizontal plane is...
asked 4 hours ago -
Use any search engine to search for articles about Starbucks
partnership with Tata Companies in India...
asked 4 hours ago -
Let’s say that for some reason Bank Excess Reserves suddenly
increase sharply. What effect would this...
asked 5 hours ago -
Given:
Curent Assets: $600,000
Total Assets: $2,600,000
Current Liabilities: $500,000
Total Liabilities: $1,700,000
What is the...
asked 5 hours ago -
1. What is a “Bankster”? What is insider trading? Why is it
illegal?
2. What is...
asked 5 hours ago