
Homework Answers

Add Answer to:
In the probability distribution to the right, the random variable X represents the number of marriages...
In the probability distribution to the right, the random variable X represents the number of marriages...
 In the probability distribution to the right, the random variable X represents the number of marriages an individual aged 15 years or older has been involved in. Complete parts (a) through (0) below 0 0.278 10.573 3 0.027 4 0.004 5 0.001 (a) Verify that this is a discrete probability distribution. This is a discrete probability distribution because theof the probabilities is (Type whole numbers. Use ascending order) (b) Draw a graph of the probability distribution Describe the shape of...
In the following probability distribution, the random variable x represents the number of activities a...
 In the following probability distribution, the random variable x represents the number of activities a parent of a 6 th- to 8th-grade student is involved in. Complete parts (a) through (f) below.x01234P(x)0.3670.1330.2090.1160.175(a) Verify that this is a discrete probability distribution.This is a discrete probability distribution because the sum of the probabilities is _______ and each probability is _______ (b) Graph the discrete probability distribution. Choose the correct graph below.(c) Compute and interpret the mean of the random variable x .The mean...
In the following probability distribution, the random variable x represents the number of activities a parent...
 In the following probability distribution, the random variable x represents the number of activities a parent of a K to 5 th-grade student is involved in. Complete parts (a) through (f) below.x01234P(x)0.1670.1940.3440.1780.117(a) Verify that this is a discrete probability distribution.This is a discrete probability distribution because the sum of the probabilities is _______ and each probability is _______ (b) Graph the discrete probability distribution. Choose the correct graph below.(c) Compute and interpret the mean of the random variable x .The mean...
please help with all. In the following probability distribution, the random variable x represents the number...
 please help with all.
In the following probability distribution, the random variable x represents the number of activities a parent of a 6th-to 8th grade student is involved in. Complete parts (a) through (1) below. * 1 0 1 2 3 4 5 P(x) 0.269 0 206 0.224 0.239 0.062 (a) Verify that this is a discrete probability distribution This is a discrete probability distribution because the sum of the probabilities is and each probability is (6) Graph the discrete...
please help with all.
In the following probability distribution, the random variable x represents the number of activities a parent of a 6th-to 8th grade student is involved in. Complete parts (a) through (1) below. * 1 0 1 2 3 4 5 P(x) 0.269 0 206 0.224 0.239 0.062 (a) Verify that this is a discrete probability distribution This is a discrete probability distribution because the sum of the probabilities is and each probability is (6) Graph the discrete...
In the probability distribution to the? right, the random variable X represents the number of hits...
In the probability distribution to the? right, the random variable X represents the number of hits a baseball player obtained in a game over the course of a season. x P(x) 0 0.1665 1 0.3356 2 0.2873 3 0.1481 4 0.0366 5 0.0259 (1) Compute and interpret the mean of the random variable X. (2) Which of the following interpretations of the mean is? correct? A. In any number of? games, one would expect the mean number of hits per...
In the following probability distribution, the random variable represents the number of activities a part of...
 In the following probability distribution, the random variable represents the number of activities a part of a toth grade students involved Complete parte (a) through inbow PM) 0.4470.1310279 0.0790054 (a) Verity that this is a discrete probability distribution This is a discrete probability distribution because the sum of the probabiliosis (b) Graph the discrete probability distribution. Choose the correct grach below. and each probability between 0 and 1, indusve 05 (c) Compute and interpret the mean of the random variable...
9. The probability distribution of the random variable X represents the number of hits a baseball...
 9. The probability distribution of the random variable X reoresents the number of hits a baseball plaver obtained in a aame for the 2012 baseball season.x012345P(x)0.16670.33820.28560.14860.03810.0228The probability distribution was used along with statistical software to simulate 25 repetitions of the experiment ( 25 games). The number of hits was recorded. Approximate the mean and standard deviation of the theoretical mean and standard deviation. What property is being illustrated?1 Click the icon to view the data tables.Compute the theoretical mean of...
Suppose the random variable X represents the number of times a person visits a walk-in medical...
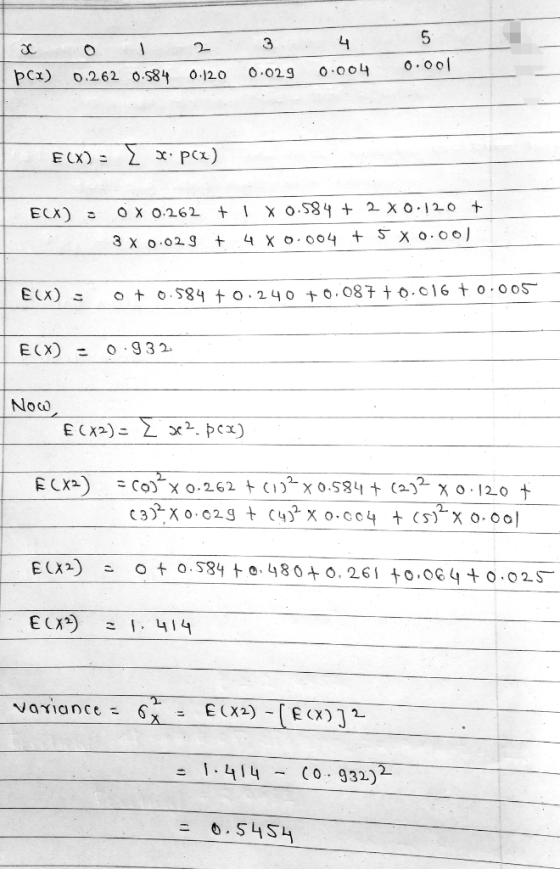
 Suppose the random variable X represents the number of times a person visits a walk-in medical clinic in a year. The probability distribution for X is given by: х 0 1 2 3 4 f(x) | 0.25 0.30 0.20 0.14 0.11 Compute V(X). Give your answer accurate to 4 decimal places. Answer:
6. In the accompanying table, the random variable x represents the number of televisions in a...
6. In the accompanying table, the random variable x represents the number of televisions in a household in a certain country. Determine whether or not the table is a probability distribution. If it is a probability distribution, find its mean and standard deviation. x P(x) 0 0.04 1 0.11 2 0.32 3 0.25 4 0.15 5 0.13 If the table is a probability distribution, what is its mean? Select the correct choice below and fill in any answer boxes within...
1. The following probability distribution represents the number of people living in a Household (X), and...
1. The following probability distribution represents the number of people living in a Household (X), and the probability of occurrence (P(X)). Compute the Expected Value (mean), the Variance and the Standard Deviation for this random variable. Show Your Calculations for the Mean. X 1 2 3 4 5 P(X) .33 .29 .27 .07 .04 2. Use the binomial formula to compute the probability of a student getting 8 correct answers on a 10...
 In the probability distribution to the right, the random variable X represents the number of marriages an individual aged 15 years or older has been involved in. Complete parts (a) through (0) below 0 0.278 10.573 3 0.027 4 0.004 5 0.001 (a) Verify that this is a discrete probability distribution. This is a discrete probability distribution because theof the probabilities is (Type whole numbers. Use ascending order) (b) Draw a graph of the probability distribution Describe the shape of...
 please help with all.
In the following probability distribution, the random variable x represents the number of activities a parent of a 6th-to 8th grade student is involved in. Complete parts (a) through (1) below. * 1 0 1 2 3 4 5 P(x) 0.269 0 206 0.224 0.239 0.062 (a) Verify that this is a discrete probability distribution This is a discrete probability distribution because the sum of the probabilities is and each probability is (6) Graph the discrete...
please help with all.
In the following probability distribution, the random variable x represents the number of activities a parent of a 6th-to 8th grade student is involved in. Complete parts (a) through (1) below. * 1 0 1 2 3 4 5 P(x) 0.269 0 206 0.224 0.239 0.062 (a) Verify that this is a discrete probability distribution This is a discrete probability distribution because the sum of the probabilities is and each probability is (6) Graph the discrete...
 In the following probability distribution, the random variable represents the number of activities a part of a toth grade students involved Complete parte (a) through inbow PM) 0.4470.1310279 0.0790054 (a) Verity that this is a discrete probability distribution This is a discrete probability distribution because the sum of the probabiliosis (b) Graph the discrete probability distribution. Choose the correct grach below. and each probability between 0 and 1, indusve 05 (c) Compute and interpret the mean of the random variable...
 Suppose the random variable X represents the number of times a person visits a walk-in medical clinic in a year. The probability distribution for X is given by: х 0 1 2 3 4 f(x) | 0.25 0.30 0.20 0.14 0.11 Compute V(X). Give your answer accurate to 4 decimal places. Answer:
Most questions answered within 3 hours.
-
Using MARS simulator, write MIPS programs according to
the following scenarios: Receive a positive integer number...
asked 13 minutes ago -
An object in front of a concave mirror has a real image that is
11.5 cm...
asked 27 minutes ago -
Consider the reaction, C3 H8 + O2 --> CO2 + H2O. How many
moles of O2...
asked 2 hours ago -
You and your opponent both roll a fair die. If you both roll the
same number,...
asked 2 hours ago -
In a study of the accuracy of fast food drive-through orders,
Restaurant A had 257 accurate...
asked 2 hours ago -
Identify and describe in detail the four categories of
institutions that could be included in a...
asked 2 hours ago -
In python
class Customer:
def __init__(self, customer_id, last_name, first_name, phone_number, address):
self._customer_id = int(customer_id)
self._last_name =...
asked 2 hours ago -
What is an example of a limitation in implementing a new
ERP system and how it...
asked 2 hours ago -
In a section of 9.7cm of an artery with a radius of 2.6mm there
is a...
asked 2 hours ago -
the two carboxylic acid groups of aspartic acid have different
acidities with pKa values of 2.1...
asked 2 hours ago -
Would CuCO3 aqueous salt combined with calcium chloride
form a solid precipitate? If so, what would...
asked 2 hours ago -
How do ECM Solutions assist in embedding a culture of continuous
improvement in an organization? (Project...
asked 3 hours ago