
Homework Answers


Add Answer to:
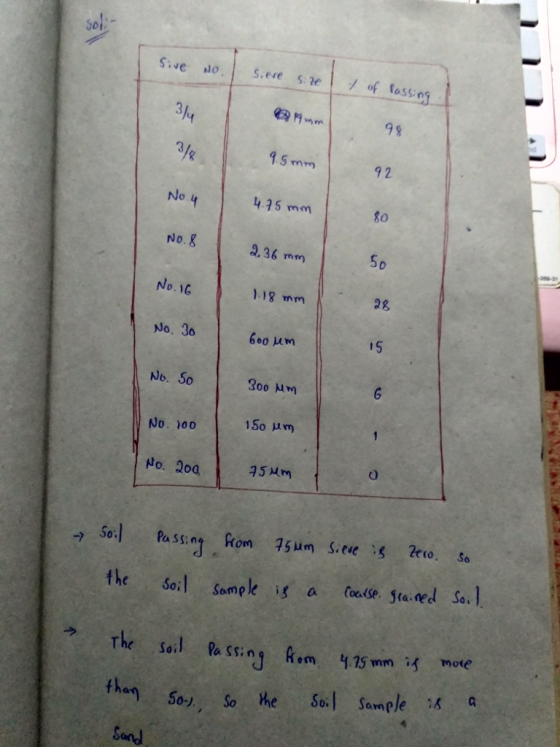
2-19 The results of a sieve analysis on a representative sample of sol are shown below:...
Problem 2 (25 points) The sieve analysis of three soils and the liquid and plastic limits...
 Problem 2 (25 points) The sieve analysis of three soils and the liquid and plastic limits of the fraction passing through the No. 40 sieve are given below. Soil C c Sieve analysis - Percent finer No.4 No. 10 No. 40 No. 200 70 65 55 36 7162 4 8 11 Atterberg tests Liquid limit Plastic limit C 33 21 32 16 2 4.8 2.9 (a) Classify Soil 1 by the USCS with the group name. (b) Classify Soil 2...
sieve analysis The results of sieve analysis are as follows: Determine the percent finer than each...
 sieve
analysis
The results of sieve analysis are as follows: Determine the percent finer than each sieve and plot the grain-size distribution curve Determine D10, D30 and D60 from the grain size distribution curve Calculate the uniformity coefficient and coefficient of gradation Determine the percentages of gravel, sand and fines using the AASHTO system and the USCS.
sieve
analysis
The results of sieve analysis are as follows: Determine the percent finer than each sieve and plot the grain-size distribution curve Determine D10, D30 and D60 from the grain size distribution curve Calculate the uniformity coefficient and coefficient of gradation Determine the percentages of gravel, sand and fines using the AASHTO system and the USCS.
Problem 3 (30 points) Sieve analysis and plasticity data are obtained as follows. Percent passing No.4...
 Problem 3 (30 points) Sieve analysis and plasticity data are obtained as follows. Percent passing No.4 sieve = Percent passing No.10 sieve = Percent passing No.40 sieve = Percent passing No.200 sieve = Liquid Limit Plasticity Index 82 71 64 41 31 12 (a) Classify the soil by the AASHTO classification system: (b) Classify the soil by the Unified Soil Classification System:
Soil Mechanics ( please answer right ASAP ) 2. The following are the results of a sieve analysis and a hydrometer an...
 Soil Mechanics ( please answer right ASAP )
2. The following are the results of a sieve analysis and a hydrometer analysis Mass Sieve number/grainretained Percent finer size 10 17 20 27 30 Sieve 54 40 60 129 140 90 200 53 0.045mm 12.1 7.8 0.028mm 0.015mm 0.005mm 0.0025mm 0.6 CE 341 Soil Mechanics NJIT Janitha Batagoda Summer 2019 Draw the grain-size distribution curve. a. Determine the percentages of gravel, sand, silt and clay according to the AASHTO system Determine...
Soil Mechanics ( please answer right ASAP )
2. The following are the results of a sieve analysis and a hydrometer analysis Mass Sieve number/grainretained Percent finer size 10 17 20 27 30 Sieve 54 40 60 129 140 90 200 53 0.045mm 12.1 7.8 0.028mm 0.015mm 0.005mm 0.0025mm 0.6 CE 341 Soil Mechanics NJIT Janitha Batagoda Summer 2019 Draw the grain-size distribution curve. a. Determine the percentages of gravel, sand, silt and clay according to the AASHTO system Determine...
The following table shows the lab results of a grain size analysis and Atterberg limits for...
 The following table shows the lab results of a grain size analysis and Atterberg limits for an inorganic soil sample (initial total mass=1029) Assume you measured a liquid limit of 40% and plastic limit of 30% for the sample. Sieve Size/No. Equivalent Sieve Size (mm) Mass Retaining(s) Mass Passing (9) Percent Passing 3" 75 11 50 0 3 19 4.75 20 2 20 15 10 No. 60 5 4 4 4 0.003 2 2 2" 3/4" No. 4 No. 10...
As part of a subsurface investigation, Temple Geotechnical Inc obtained a bulk sample of soil for...
 As part of a subsurface investigation, Temple Geotechnical Inc obtained a bulk sample of soil for classification purposes. Given the grain size distribution plot and plasticity information 18, PL 13) for this sample, classify the given soil using the Unified Soil Classification System (USCS) and American Association of State Highway and Transportation Officials ( System. (LL· AASHTO) B4 #10 #40 #200 100 90 80 70 E 60 E . s 50 E 40 30 è 20 0 0 100 10...
please do a and b neat and clear Problem 5 (3 points) The sieve analysis of...
 please do a and b neat and clear
Problem 5 (3 points) The sieve analysis of two soils and the liquid and plastic limits of the fraction passing through the No. 40 sieve are given below. Classify the soils by the AASHTO classification system and give the group index for each soil. Soil 1 2 Liquid limit Sieve analysis-Percent finer No.10 No. 40 No. 200 85 55 45 94 80 63 28 40 Plasticity index 20 21 b. Determine the...
please do a and b neat and clear
Problem 5 (3 points) The sieve analysis of two soils and the liquid and plastic limits of the fraction passing through the No. 40 sieve are given below. Classify the soils by the AASHTO classification system and give the group index for each soil. Soil 1 2 Liquid limit Sieve analysis-Percent finer No.10 No. 40 No. 200 85 55 45 94 80 63 28 40 Plasticity index 20 21 b. Determine the...
sample of aggregate and produced on a performed A sieve analysis test was the results shown...
 sample of aggregate and produced on a performed A sieve analysis test was the results shown in Table P5.21. 5.21 TABLE P5.21 Amount Retained, g Sieve Size, Amount Retained, g mm Sieve Size, mm 891.5 1.18 0 25 wola ndi 712.6 0.60 376.7 19 625.2 0.30 888.4 12.5 581.5 0.15 506.2 9.5 242.9 0.075 1038.4 4.75 44.9 Pan 900.1 2.36 noCalculate the percent passing through each sieve. Plot the percent passing versus sieve size on: semilog gradation chart, and b....
A Sieve analysis test was performed on a sample of coarse aggregate and produced the results...
 A Sieve analysis test was performed on a sample of coarse
aggregate and produced the results in Table P5.22
a) Calculate the percent passing through each sieve.
b) What is the maximum size?
c) What is the nominal maximum size?
d) plot the percent passing versus sieve size on a semilog
gradation chart.
e) Plot the percent passing versus sieve size on a 0.45
gradation chart.
f) Referring to Table 5.5 (ASTM C33), what is the closest size
number and...
A Sieve analysis test was performed on a sample of coarse
aggregate and produced the results in Table P5.22
a) Calculate the percent passing through each sieve.
b) What is the maximum size?
c) What is the nominal maximum size?
d) plot the percent passing versus sieve size on a semilog
gradation chart.
e) Plot the percent passing versus sieve size on a 0.45
gradation chart.
f) Referring to Table 5.5 (ASTM C33), what is the closest size
number and...
Part a : answer is A-1-B Not sure part B ented for the given soil sample,...
 Part a : answer is A-1-B
Not sure part B
ented for the given soil sample, determine the soil classification using Using the oillassification System (USCS) and the AASHTO Soil classification system. Give the group index if needed. Percent Passing 98 85 Sieve No. 19mm k in.) 12.5mm (1/2in.) No. 4 (4.75 mm) No. 10 (2.00 mm) No. 20 (0.850 mm) No. 40 (0.425 mm) No. 100(0.150 mm) No. 200 (0.075 mm) 80 60 45 30 20 10 / レ...
Part a : answer is A-1-B
Not sure part B
ented for the given soil sample, determine the soil classification using Using the oillassification System (USCS) and the AASHTO Soil classification system. Give the group index if needed. Percent Passing 98 85 Sieve No. 19mm k in.) 12.5mm (1/2in.) No. 4 (4.75 mm) No. 10 (2.00 mm) No. 20 (0.850 mm) No. 40 (0.425 mm) No. 100(0.150 mm) No. 200 (0.075 mm) 80 60 45 30 20 10 / レ...
 Problem 2 (25 points) The sieve analysis of three soils and the liquid and plastic limits of the fraction passing through the No. 40 sieve are given below. Soil C c Sieve analysis - Percent finer No.4 No. 10 No. 40 No. 200 70 65 55 36 7162 4 8 11 Atterberg tests Liquid limit Plastic limit C 33 21 32 16 2 4.8 2.9 (a) Classify Soil 1 by the USCS with the group name. (b) Classify Soil 2...
 sieve
analysis
The results of sieve analysis are as follows: Determine the percent finer than each sieve and plot the grain-size distribution curve Determine D10, D30 and D60 from the grain size distribution curve Calculate the uniformity coefficient and coefficient of gradation Determine the percentages of gravel, sand and fines using the AASHTO system and the USCS.
sieve
analysis
The results of sieve analysis are as follows: Determine the percent finer than each sieve and plot the grain-size distribution curve Determine D10, D30 and D60 from the grain size distribution curve Calculate the uniformity coefficient and coefficient of gradation Determine the percentages of gravel, sand and fines using the AASHTO system and the USCS.
 Problem 3 (30 points) Sieve analysis and plasticity data are obtained as follows. Percent passing No.4 sieve = Percent passing No.10 sieve = Percent passing No.40 sieve = Percent passing No.200 sieve = Liquid Limit Plasticity Index 82 71 64 41 31 12 (a) Classify the soil by the AASHTO classification system: (b) Classify the soil by the Unified Soil Classification System:
 Soil Mechanics ( please answer right ASAP )
2. The following are the results of a sieve analysis and a hydrometer analysis Mass Sieve number/grainretained Percent finer size 10 17 20 27 30 Sieve 54 40 60 129 140 90 200 53 0.045mm 12.1 7.8 0.028mm 0.015mm 0.005mm 0.0025mm 0.6 CE 341 Soil Mechanics NJIT Janitha Batagoda Summer 2019 Draw the grain-size distribution curve. a. Determine the percentages of gravel, sand, silt and clay according to the AASHTO system Determine...
Soil Mechanics ( please answer right ASAP )
2. The following are the results of a sieve analysis and a hydrometer analysis Mass Sieve number/grainretained Percent finer size 10 17 20 27 30 Sieve 54 40 60 129 140 90 200 53 0.045mm 12.1 7.8 0.028mm 0.015mm 0.005mm 0.0025mm 0.6 CE 341 Soil Mechanics NJIT Janitha Batagoda Summer 2019 Draw the grain-size distribution curve. a. Determine the percentages of gravel, sand, silt and clay according to the AASHTO system Determine...
 The following table shows the lab results of a grain size analysis and Atterberg limits for an inorganic soil sample (initial total mass=1029) Assume you measured a liquid limit of 40% and plastic limit of 30% for the sample. Sieve Size/No. Equivalent Sieve Size (mm) Mass Retaining(s) Mass Passing (9) Percent Passing 3" 75 11 50 0 3 19 4.75 20 2 20 15 10 No. 60 5 4 4 4 0.003 2 2 2" 3/4" No. 4 No. 10...
 As part of a subsurface investigation, Temple Geotechnical Inc obtained a bulk sample of soil for classification purposes. Given the grain size distribution plot and plasticity information 18, PL 13) for this sample, classify the given soil using the Unified Soil Classification System (USCS) and American Association of State Highway and Transportation Officials ( System. (LL· AASHTO) B4 #10 #40 #200 100 90 80 70 E 60 E . s 50 E 40 30 è 20 0 0 100 10...
 please do a and b neat and clear
Problem 5 (3 points) The sieve analysis of two soils and the liquid and plastic limits of the fraction passing through the No. 40 sieve are given below. Classify the soils by the AASHTO classification system and give the group index for each soil. Soil 1 2 Liquid limit Sieve analysis-Percent finer No.10 No. 40 No. 200 85 55 45 94 80 63 28 40 Plasticity index 20 21 b. Determine the...
please do a and b neat and clear
Problem 5 (3 points) The sieve analysis of two soils and the liquid and plastic limits of the fraction passing through the No. 40 sieve are given below. Classify the soils by the AASHTO classification system and give the group index for each soil. Soil 1 2 Liquid limit Sieve analysis-Percent finer No.10 No. 40 No. 200 85 55 45 94 80 63 28 40 Plasticity index 20 21 b. Determine the...
 sample of aggregate and produced on a performed A sieve analysis test was the results shown in Table P5.21. 5.21 TABLE P5.21 Amount Retained, g Sieve Size, Amount Retained, g mm Sieve Size, mm 891.5 1.18 0 25 wola ndi 712.6 0.60 376.7 19 625.2 0.30 888.4 12.5 581.5 0.15 506.2 9.5 242.9 0.075 1038.4 4.75 44.9 Pan 900.1 2.36 noCalculate the percent passing through each sieve. Plot the percent passing versus sieve size on: semilog gradation chart, and b....
 A Sieve analysis test was performed on a sample of coarse
aggregate and produced the results in Table P5.22
a) Calculate the percent passing through each sieve.
b) What is the maximum size?
c) What is the nominal maximum size?
d) plot the percent passing versus sieve size on a semilog
gradation chart.
e) Plot the percent passing versus sieve size on a 0.45
gradation chart.
f) Referring to Table 5.5 (ASTM C33), what is the closest size
number and...
A Sieve analysis test was performed on a sample of coarse
aggregate and produced the results in Table P5.22
a) Calculate the percent passing through each sieve.
b) What is the maximum size?
c) What is the nominal maximum size?
d) plot the percent passing versus sieve size on a semilog
gradation chart.
e) Plot the percent passing versus sieve size on a 0.45
gradation chart.
f) Referring to Table 5.5 (ASTM C33), what is the closest size
number and...
 Part a : answer is A-1-B
Not sure part B
ented for the given soil sample, determine the soil classification using Using the oillassification System (USCS) and the AASHTO Soil classification system. Give the group index if needed. Percent Passing 98 85 Sieve No. 19mm k in.) 12.5mm (1/2in.) No. 4 (4.75 mm) No. 10 (2.00 mm) No. 20 (0.850 mm) No. 40 (0.425 mm) No. 100(0.150 mm) No. 200 (0.075 mm) 80 60 45 30 20 10 / レ...
Part a : answer is A-1-B
Not sure part B
ented for the given soil sample, determine the soil classification using Using the oillassification System (USCS) and the AASHTO Soil classification system. Give the group index if needed. Percent Passing 98 85 Sieve No. 19mm k in.) 12.5mm (1/2in.) No. 4 (4.75 mm) No. 10 (2.00 mm) No. 20 (0.850 mm) No. 40 (0.425 mm) No. 100(0.150 mm) No. 200 (0.075 mm) 80 60 45 30 20 10 / レ...
Most questions answered within 3 hours.
-
How do you think we should value management? Specifically how
might we try to determine MRPL...
asked 4 minutes ago -
Suppose the Central Bank of Turkey starts to pay
interest on reserves. Under what circumstances this...
asked 13 minutes ago -
In python,write a function nameSet(first, last) that takes a
person's first and last names as input,...
asked 12 minutes ago -
For Bergson the concept of Being contains less reality than does
the concept of Becoming. True...
asked 1 hour ago -
What is the hydroxide ion concentration, [OH-], in a solution
with a hydronium ion concentration, [H3O+]...
asked 1 hour ago -
What species is the reducing agent in the following
equation?
Mg(s) + 2HCl (aq) --> MgCl2(aq)...
asked 1 hour ago -
A 50g ice cube is taken out of a freezer at 0 degrees Celsius
and put...
asked 3 hours ago -
How do ratios help you determine trends? What specific
information do managers look at? Is there...
asked 3 hours ago -
A wavelength of 514 nm is used to find an unknown diffraction
grating. If the separation...
asked 3 hours ago -
Use the central limit theorem to find the mean and standard
error of the mean of...
asked 3 hours ago -
You will be given a file that will contain averages for classes
which are divided into...
asked 3 hours ago -
A Pew Research Center poll surveyed a random sample 850 voters
and asked them if they...
asked 3 hours ago