Active Low-pass and High-pass Filters for Crossover Circuitry (PSPICE)

- Design a first order active high-pass filter with cut-off frequency of 1 kHz & gain 20dB.
- Design a first order active low-pass filter with cut-off frequency of 1 kHz & gain 20dB.
- Plot the magnitude and phase responses of the active high-pass and low-pass filters you have designed using PSpice (Use UA741 Op amp and ±12V dual supply).
- Connect your active low-pass and high-pass filters as shown in Fig. 1-b. Assume that Tweeter speaker and Woofer speaker have resistance of 8 Ω and 16 Ω respectively. Plot the magnitude and phase responses of the circuit by taking the output from Tweeter speaker and Woofer speaker respectively for parallel crossover circuit using PSpice.
- Calculate the two transfer functions Vo(tweeter)/Vinput and Vo(woofer)/Vinputfor the circuit given in Fig. 1-b. Sketch the magnitude and phase responses of the parallel crossover circuit and check your results using PSpice.
Homework Answers
Question (a)
The circuit diagram of a first order active low pass filter is shown below

The Pass Band Gain is given by

The Cut off Frequency

We need the pass band gain to be 20 dB
So


So


Let us take 
Then

The higher cut off frequency of a first order low pass filter is given by

Now the cut off frequency required is 1 kHz
So

Let us take 
Then

So the circuit is

Question (b)
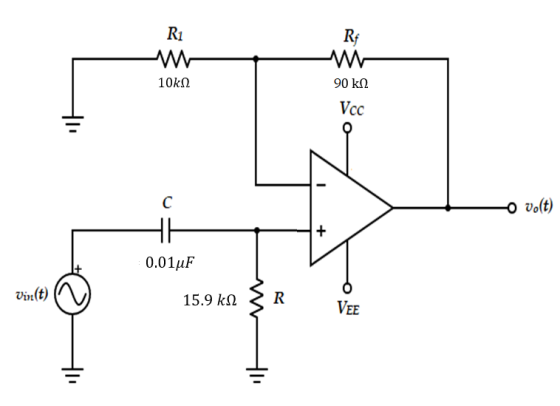
The circuit diagram of a first order active high pass filter is shown below

The Pass Band Gain is given by

The Cut off Frequency

We need the pass band gain to be 20 dB
So


So


Let us take 
Then

The lower cut off frequency of a first order low pass filter is given by

Now the cut off frequency required is 1 kHz
So

Let us take 
Then

So the circuit is
Question (c)
Simulation of Low Pass Filter in Pspice
The Circuit diagram is wired as follows
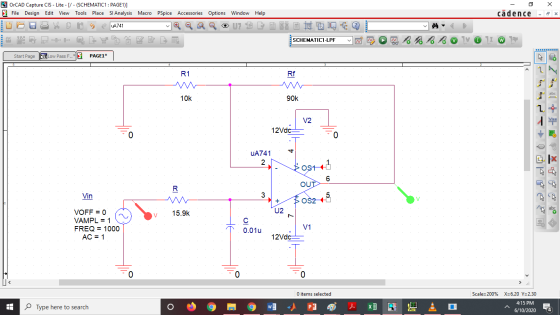
The simulation profile

After running we get

The plot shows the variation of output voltage (green) as frequecny is increased. The input is a constant at 1V shown by the red line. We can see that the pass band gain is 10V/1V = 10 as we had designed.
The gain in dB Vs frequency plot can be plotted as follows

Now we get gain in dB plot as follows

We can see that the pass band gain is 20dB as we wanted
The cut off frequency is marked

We can see that it is 998.34370 Hz
For the HIGH PASS FILTER


Gain in dB


We can see that the pass band gain in dB is 20 dB
Fig 1 b is not given.
Add Answer to:
Active Low-pass and High-pass Filters for Crossover Circuitry
(PSPICE)
Design a first order active high-pass filter...
The first step in the design phase for this lab is to decide on appropriate pass...
 The first step in the design phase for this lab is to decide on
appropriate pass and stop frequencies for each filter. The tweeter
speaker can reproduce frequencies greater than 6kHz, and the woofer
can reproduce frequencies less than 200Hz. For proper sound, the
midrange should reproduce all frequencies not produced by the
subwoofer or tweeter.
Design a low pass, band pass, and high pass filters with
appropriate pass frequencies. The design will be simulated in
Multisim using an AC...
The first step in the design phase for this lab is to decide on
appropriate pass and stop frequencies for each filter. The tweeter
speaker can reproduce frequencies greater than 6kHz, and the woofer
can reproduce frequencies less than 200Hz. For proper sound, the
midrange should reproduce all frequencies not produced by the
subwoofer or tweeter.
Design a low pass, band pass, and high pass filters with
appropriate pass frequencies. The design will be simulated in
Multisim using an AC...
A) Design a low-pass filter using the given circuitry with a cut-off value of 1 kHz and plot the ...
 a) Design a low-pass filter using the given circuitry with a cut-off value of 1 kHz and plot the frequency response curve on the given axes 1.0 0.7 0.5 in out 0.0 101 102 103 104 10s Hz b) Design a band-pass filter using the given circuitry with a bandwidth of 500 Hz and a lower cut-off value of 100 Hz, and draw the frequency response curve. Keep all resistors at the same value (i.e. Ri-R-R3-R4). 1.0 0.7 0.5 0.0...
Find The values, C1, C2, L1, L2, R1, R2, R3. The tweeter speaker can reproduce frequencies...
 Find The values, C1, C2, L1, L2, R1, R2, R3. The tweeter speaker can reproduce frequencies greater than 6kHz, and the woofer can reproduce frequencies less than 200Hz. For proper sound, the midrange should reproduce all frequencies not produced by the subwoofer or tweeter. C2 C1 L2 V1 L1 R1 R3 R2 Midrange Tweeter Woofer Fig. 2. Equivalent model. The values of Ri, R2, R3, L1, L2, G. and C, are selected so that the filters have the same cutoff...
(a) Design a first–order high-pass filter with a cutoff frequency fc = 1.5 kHz and a passband gain |Ao| = 20dB, using a...
(a) Design a first–order high-pass filter with a cutoff frequency fc = 1.5 kHz and a passband gain |Ao| = 20dB, using a capacitor C = 47nF. Include a compensation resistor and determine its value. (b) Sketch the frequency response for the circuit (i.e., magnitude vs. frequency and phase vs. frequency). On the magnitude response plot, indicate the cutoff frequency, bandpass gain, and bandstop rolloff slope. On the phase response plot, indicate the approximate value of the phase angle at...
C, V. Low-pass High-pass Procedure: Design the following filters and be certain to provide the co...
 C, V. Low-pass High-pass Procedure: Design the following filters and be certain to provide the component values you used in a table like those shown on the third page. Record your calculations because they will be requested in the lab report. To make the lab simpler let the input resistor Ri be the same for all stages. In this particular case the loading effects from cascading the op-amp circuits will have little influence on the overall gain. Refer to your...
For the low-pass filter circuit shown in Fig 2 3k Ω 200mil in out Fig 2 3.a. Use a 2.2nF capacitor to design a high-pas...
 For the low-pass filter circuit shown in Fig 2 3k Ω 200mil in out Fig 2 3.a. Use a 2.2nF capacitor to design a high-pass filter to have a cutoff frequency of Skn Draw a schematic of your design. Show all component values and voltages c. Sketch the frequency response of the voltage gain and phase shift Magnitude dB Frequency Hz Phase Frequency Hz
For the low-pass filter circuit shown in Fig 2 3k Ω 200mil in out Fig 2...
For the low-pass filter circuit shown in Fig 2 3k Ω 200mil in out Fig 2 3.a. Use a 2.2nF capacitor to design a high-pass filter to have a cutoff frequency of Skn Draw a schematic of your design. Show all component values and voltages c. Sketch the frequency response of the voltage gain and phase shift Magnitude dB Frequency Hz Phase Frequency Hz
For the low-pass filter circuit shown in Fig 2 3k Ω 200mil in out Fig 2...
What makes a active high pass filter different from an active low pass filter? How are...
What makes a active high pass filter different from an active low pass filter? How are they set up different in a circuit?
13.6 Design a first-order active high-pass filter with a response of +12 dB in the high-frequency...
 13.6 Design a first-order active high-pass filter with a response of +12 dB in the high-frequency limit and -20 dB at 1.2 kHz. Let C 1 nF
13.6 Design a first-order active high-pass filter with a response of +12 dB in the high-frequency limit and -20 dB at 1.2 kHz. Let C 1 nF
13.6 Design a first-order active high-pass filter with a response of +12 dB in the high-frequency limit and -20 dB at 1.2 kHz. Let C 1 nF
Design a -40 dB second order low pass active filter for a cut-off frequency of 3...
Design a -40 dB second order low pass active filter for a cut-off frequency of 3 kHz. You are free to choose the values of resistors and capacitors.
(a) Design a first order active low pass filter with a corner frequency of 1 kHz...
 (a) Design a first order active low pass filter with a corner frequency of 1 kHz and a normalized transfer function of 1/(s + 1.96523). You may assume C = 10 nF.
 The first step in the design phase for this lab is to decide on
appropriate pass and stop frequencies for each filter. The tweeter
speaker can reproduce frequencies greater than 6kHz, and the woofer
can reproduce frequencies less than 200Hz. For proper sound, the
midrange should reproduce all frequencies not produced by the
subwoofer or tweeter.
Design a low pass, band pass, and high pass filters with
appropriate pass frequencies. The design will be simulated in
Multisim using an AC...
The first step in the design phase for this lab is to decide on
appropriate pass and stop frequencies for each filter. The tweeter
speaker can reproduce frequencies greater than 6kHz, and the woofer
can reproduce frequencies less than 200Hz. For proper sound, the
midrange should reproduce all frequencies not produced by the
subwoofer or tweeter.
Design a low pass, band pass, and high pass filters with
appropriate pass frequencies. The design will be simulated in
Multisim using an AC...
 a) Design a low-pass filter using the given circuitry with a cut-off value of 1 kHz and plot the frequency response curve on the given axes 1.0 0.7 0.5 in out 0.0 101 102 103 104 10s Hz b) Design a band-pass filter using the given circuitry with a bandwidth of 500 Hz and a lower cut-off value of 100 Hz, and draw the frequency response curve. Keep all resistors at the same value (i.e. Ri-R-R3-R4). 1.0 0.7 0.5 0.0...
 Find The values, C1, C2, L1, L2, R1, R2, R3. The tweeter speaker can reproduce frequencies greater than 6kHz, and the woofer can reproduce frequencies less than 200Hz. For proper sound, the midrange should reproduce all frequencies not produced by the subwoofer or tweeter. C2 C1 L2 V1 L1 R1 R3 R2 Midrange Tweeter Woofer Fig. 2. Equivalent model. The values of Ri, R2, R3, L1, L2, G. and C, are selected so that the filters have the same cutoff...
 C, V. Low-pass High-pass Procedure: Design the following filters and be certain to provide the component values you used in a table like those shown on the third page. Record your calculations because they will be requested in the lab report. To make the lab simpler let the input resistor Ri be the same for all stages. In this particular case the loading effects from cascading the op-amp circuits will have little influence on the overall gain. Refer to your...
 For the low-pass filter circuit shown in Fig 2 3k Ω 200mil in out Fig 2 3.a. Use a 2.2nF capacitor to design a high-pass filter to have a cutoff frequency of Skn Draw a schematic of your design. Show all component values and voltages c. Sketch the frequency response of the voltage gain and phase shift Magnitude dB Frequency Hz Phase Frequency Hz
For the low-pass filter circuit shown in Fig 2 3k Ω 200mil in out Fig 2...
For the low-pass filter circuit shown in Fig 2 3k Ω 200mil in out Fig 2 3.a. Use a 2.2nF capacitor to design a high-pass filter to have a cutoff frequency of Skn Draw a schematic of your design. Show all component values and voltages c. Sketch the frequency response of the voltage gain and phase shift Magnitude dB Frequency Hz Phase Frequency Hz
For the low-pass filter circuit shown in Fig 2 3k Ω 200mil in out Fig 2...
 13.6 Design a first-order active high-pass filter with a response of +12 dB in the high-frequency limit and -20 dB at 1.2 kHz. Let C 1 nF
13.6 Design a first-order active high-pass filter with a response of +12 dB in the high-frequency limit and -20 dB at 1.2 kHz. Let C 1 nF
13.6 Design a first-order active high-pass filter with a response of +12 dB in the high-frequency limit and -20 dB at 1.2 kHz. Let C 1 nF
 (a) Design a first order active low pass filter with a corner frequency of 1 kHz and a normalized transfer function of 1/(s + 1.96523). You may assume C = 10 nF.
Most questions answered within 3 hours.
-
If you mixed 35.0 mLmL of 0.100 M Tris-HCl with 65.0
mLmL of 0.200 M Tris-base, what would...
asked 1 minute ago -
Which force do you think wields a stronger influence over our
ethical behavior – our personal...
asked 7 minutes ago -
11.1 In the northeast
regions of the United States and in eastern Canada, many people
heat their...
asked 6 minutes ago -
Explain traveling wave theory. Explain how the peaking of the
wave leads to action potentials and...
asked 4 minutes ago -
What is the entropy change to the surroundings when 1 mol of ice
melts in someone's...
asked 7 minutes ago -
Are adult gamers less likely to use a gaming console (Xbox,
PlayStation, Wii, etc...) than teen...
asked 12 minutes ago -
Pt1
An electrochemical cell is set up at 25°C based on the overall
reaction represented by...
asked 14 minutes ago -
Bruin, Inc., has identified the following two mutually
exclusive projects:
Year
Cash Flow (A)
Cash...
asked 15 minutes ago -
A mutual fund salesperson has arranged to call on four people
tomorrow. Based on past experience...
asked 19 minutes ago -
The decomposition of SO2Cl2 is first order
and has a rate constant of + 2.90 x...
asked 41 minutes ago -
A solid, frictionless cylindrical reel of mass M=5.00kg and
radius R=0.55m is used to draw water...
asked 1 hour ago -
The work done by the spring's restoring force
on the free end of a spring while...
asked 36 minutes ago