I need to figure out how to solve this with MATLAB if anyone
could give me a hand.
Homework Answers
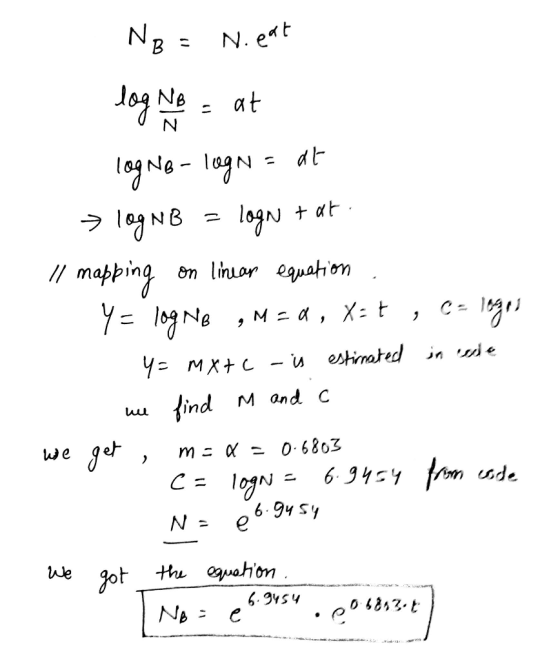
Formulation:
Code:
t = 1:6;
NB = [2000 4500 7500 15000 31000 64000];
%estmating exponential function using linear regression
Y = log(NB);
%to get coefficients m and c
p = polyfit(t, Y, 1);
m = p(1);
c = p(2);
%plotting data
scatter(t, NB);
grid on;
hold on;
%calculating N with above equation
N = exp(c);
%calculating N with above equation
alpha = m;
%our determined exponential fit function
NBE = N.*exp(alpha.*t);
plot(t, NBE);
title("Number of bacteria vs Time");
xlabel("Time (in hours)");
ylabel("Number of bacteria NB");
legend("Data", "Exponential Fit");
%estimating number of bacteria at t = 4.5hr
Nq = N*exp(alpha*4.5);
fprintf("Number of bacteria at t = 4.5hr : %d",fix(Nq));
Output:

Add Answer to:
I need to figure out how to solve this with MATLAB if anyone
could give me...
Can someone help me figure out how to write code on Matlab for either of these...
 Can someone help me figure out how to write code on Matlab for
either of these two questions? My biggest problem is working with
the large factorials which Matlab can't seem to handle
1. Write a code to calculate nas a function of ga, when NA l300, 600, 3000, 6000, NB (200, 400, 2000, 4000), and g 100, plot them and try to find some tendency when N increases (hint: 4 plots). 2. Write a code to calculate the probability...
Can someone help me figure out how to write code on Matlab for
either of these two questions? My biggest problem is working with
the large factorials which Matlab can't seem to handle
1. Write a code to calculate nas a function of ga, when NA l300, 600, 3000, 6000, NB (200, 400, 2000, 4000), and g 100, plot them and try to find some tendency when N increases (hint: 4 plots). 2. Write a code to calculate the probability...
i need the answer to be on a MatLab window 1. Consider the following equation, which...
 i need the answer to be on a MatLab window
1. Consider the following equation, which represents the concentration (c, in mg/ml) of a drug in the bloodstream over time (t, in seconds). Assume we are interested in a concentration of c2 mg/ml C3te-0.4t A. Estimate the times at which the concentration is 2 mg/ml using a graphical method Be sure to show your plot(s). Hint: There are 2 real solutions B. Use MATLAB to apply the secant method (e.g....
i need the answer to be on a MatLab window
1. Consider the following equation, which represents the concentration (c, in mg/ml) of a drug in the bloodstream over time (t, in seconds). Assume we are interested in a concentration of c2 mg/ml C3te-0.4t A. Estimate the times at which the concentration is 2 mg/ml using a graphical method Be sure to show your plot(s). Hint: There are 2 real solutions B. Use MATLAB to apply the secant method (e.g....
I'm struggling a bit in physics, if anyone can help me out soon, that'd be great!!...
 I'm
struggling a bit in physics, if anyone can help me out soon, that'd
be great!!
3. In Lab #05 - Free Fall Motion, the time and position of a freely falling object are measured. The results are shown in Table 3. Assuming the position equation has the form of Y ) - Ata + Bt + C, (a) determine the function Y(t) by using the given data in Table 3. (b) Calculate the gravitational acceleration, g, and initial velocity....
I'm
struggling a bit in physics, if anyone can help me out soon, that'd
be great!!
3. In Lab #05 - Free Fall Motion, the time and position of a freely falling object are measured. The results are shown in Table 3. Assuming the position equation has the form of Y ) - Ata + Bt + C, (a) determine the function Y(t) by using the given data in Table 3. (b) Calculate the gravitational acceleration, g, and initial velocity....
This is a matlab HW that I need the code for, if someone could help me figure this out it would b...
 This is a matlab HW that I need the code for, if someone could
help me figure this out it would be appreciated.
The value of t can be estimated from the following equation: in your script file, estimate the value of π for any number of terms. You must ask the user for the desired number of terms and calculate the absolute error/difference between your calculation and the built-in MATLAB value ofpi. Display your results with the following message...
This is a matlab HW that I need the code for, if someone could
help me figure this out it would be appreciated.
The value of t can be estimated from the following equation: in your script file, estimate the value of π for any number of terms. You must ask the user for the desired number of terms and calculate the absolute error/difference between your calculation and the built-in MATLAB value ofpi. Display your results with the following message...
Please help me solve the bottom two question using Matlab and show the steps to do...
 Please help me solve the bottom two question using Matlab and
show the steps to do it. Thanks. i appreciate your help
(12 points each) 10. In dynamics course, a particle move in the elliptical slots due to the motion of the slotted link as shown on the figure. The normal acceleration of the particle is proportional to the velocity square over the radius of curvature (r). + y2 = 1000 _(1 + (x) 325 r(x) = — a) Calculated...
Please help me solve the bottom two question using Matlab and
show the steps to do it. Thanks. i appreciate your help
(12 points each) 10. In dynamics course, a particle move in the elliptical slots due to the motion of the slotted link as shown on the figure. The normal acceleration of the particle is proportional to the velocity square over the radius of curvature (r). + y2 = 1000 _(1 + (x) 325 r(x) = — a) Calculated...
I have no idea how to solve these types of problems. Can anyone help me out?...
I have no idea how to solve these types of problems. Can anyone help me out? If n=20, μ=15, =20 and S=10, to do a one-sided hypothesis test with significance level, α=1%, you will read a t-value table of:
Please help me, my professor wants us to explain step by step each problem but I...
 Please help me, my professor wants us to explain step by step each
problem but I cant! This is worth many points so please help me!
Thank you!
Writing Assignment 4 The following application and statements a., b., d., e., and f. can be found Sullivan's PreCalculus 9t www wennnnm edition pages 336-337. "A strain of E-coli SC18del-recA718 is placed into a nutrient broth at 30° Celsius and allowed to grow. The data given below are collected where x is...
Please help me, my professor wants us to explain step by step each
problem but I cant! This is worth many points so please help me!
Thank you!
Writing Assignment 4 The following application and statements a., b., d., e., and f. can be found Sullivan's PreCalculus 9t www wennnnm edition pages 336-337. "A strain of E-coli SC18del-recA718 is placed into a nutrient broth at 30° Celsius and allowed to grow. The data given below are collected where x is...
I don’t think my graph is correct. Could someone compare and help me figure out the...
 I don’t think my graph is correct. Could someone compare and
help me figure out the answers for the next part?
Table 1: Data for Solenoid 1. Voltage (V) Current (A) B-Field (T) 0 0 0 0.2 0.11 0.39 0.6 0.27 0.95 1.0 0.51 1.86 1.3 0.75 2.71 1.6 0.96 3.5 1.9 1.25 4.5 2.5 1.48 5.7 1.6 . 1.4 y = 0.6236x -0.0431 R=0.9878 1.2 1 0.8 of current from 0 A to 1.5 A, recording the appropriate B-field...
I don’t think my graph is correct. Could someone compare and
help me figure out the answers for the next part?
Table 1: Data for Solenoid 1. Voltage (V) Current (A) B-Field (T) 0 0 0 0.2 0.11 0.39 0.6 0.27 0.95 1.0 0.51 1.86 1.3 0.75 2.71 1.6 0.96 3.5 1.9 1.25 4.5 2.5 1.48 5.7 1.6 . 1.4 y = 0.6236x -0.0431 R=0.9878 1.2 1 0.8 of current from 0 A to 1.5 A, recording the appropriate B-field...
Hello, I have a lab that we have used bending sense in our hand joint and...
 Hello, I have a lab that we have used bending sense in
our hand joint and we build a voltage decider to record voltage
change as angle of hand joint change as number (4) said : I did
record my values in a table1 below. However, I need help in number
(5). How would I plot these values in Matlab ? can some one help me
plotting what is asked in #5 ? I need help in this Matlab coding...
Hello, I have a lab that we have used bending sense in
our hand joint and we build a voltage decider to record voltage
change as angle of hand joint change as number (4) said : I did
record my values in a table1 below. However, I need help in number
(5). How would I plot these values in Matlab ? can some one help me
plotting what is asked in #5 ? I need help in this Matlab coding...
can someone help me with this i am stuck with all these questions i dont get...
 can someone help me with this i am stuck with all these
questions i dont get it
Here are summary statistics for randomly selected weights of newborn girts: n = 155, X = 33.6 hg, 8 = 6.5 hg. Construct a confidence interval estimate of the mean. Use a 99% confidence level. Are these results very different from the confidence interval 31.3 hg <u <35.1 hg with only 13 sample values, x = 33.2 hg, and s = 2.3 hg?...
can someone help me with this i am stuck with all these
questions i dont get it
Here are summary statistics for randomly selected weights of newborn girts: n = 155, X = 33.6 hg, 8 = 6.5 hg. Construct a confidence interval estimate of the mean. Use a 99% confidence level. Are these results very different from the confidence interval 31.3 hg <u <35.1 hg with only 13 sample values, x = 33.2 hg, and s = 2.3 hg?...
 Can someone help me figure out how to write code on Matlab for
either of these two questions? My biggest problem is working with
the large factorials which Matlab can't seem to handle
1. Write a code to calculate nas a function of ga, when NA l300, 600, 3000, 6000, NB (200, 400, 2000, 4000), and g 100, plot them and try to find some tendency when N increases (hint: 4 plots). 2. Write a code to calculate the probability...
Can someone help me figure out how to write code on Matlab for
either of these two questions? My biggest problem is working with
the large factorials which Matlab can't seem to handle
1. Write a code to calculate nas a function of ga, when NA l300, 600, 3000, 6000, NB (200, 400, 2000, 4000), and g 100, plot them and try to find some tendency when N increases (hint: 4 plots). 2. Write a code to calculate the probability...
 i need the answer to be on a MatLab window
1. Consider the following equation, which represents the concentration (c, in mg/ml) of a drug in the bloodstream over time (t, in seconds). Assume we are interested in a concentration of c2 mg/ml C3te-0.4t A. Estimate the times at which the concentration is 2 mg/ml using a graphical method Be sure to show your plot(s). Hint: There are 2 real solutions B. Use MATLAB to apply the secant method (e.g....
i need the answer to be on a MatLab window
1. Consider the following equation, which represents the concentration (c, in mg/ml) of a drug in the bloodstream over time (t, in seconds). Assume we are interested in a concentration of c2 mg/ml C3te-0.4t A. Estimate the times at which the concentration is 2 mg/ml using a graphical method Be sure to show your plot(s). Hint: There are 2 real solutions B. Use MATLAB to apply the secant method (e.g....
 I'm
struggling a bit in physics, if anyone can help me out soon, that'd
be great!!
3. In Lab #05 - Free Fall Motion, the time and position of a freely falling object are measured. The results are shown in Table 3. Assuming the position equation has the form of Y ) - Ata + Bt + C, (a) determine the function Y(t) by using the given data in Table 3. (b) Calculate the gravitational acceleration, g, and initial velocity....
I'm
struggling a bit in physics, if anyone can help me out soon, that'd
be great!!
3. In Lab #05 - Free Fall Motion, the time and position of a freely falling object are measured. The results are shown in Table 3. Assuming the position equation has the form of Y ) - Ata + Bt + C, (a) determine the function Y(t) by using the given data in Table 3. (b) Calculate the gravitational acceleration, g, and initial velocity....
 This is a matlab HW that I need the code for, if someone could
help me figure this out it would be appreciated.
The value of t can be estimated from the following equation: in your script file, estimate the value of π for any number of terms. You must ask the user for the desired number of terms and calculate the absolute error/difference between your calculation and the built-in MATLAB value ofpi. Display your results with the following message...
This is a matlab HW that I need the code for, if someone could
help me figure this out it would be appreciated.
The value of t can be estimated from the following equation: in your script file, estimate the value of π for any number of terms. You must ask the user for the desired number of terms and calculate the absolute error/difference between your calculation and the built-in MATLAB value ofpi. Display your results with the following message...
 Please help me solve the bottom two question using Matlab and
show the steps to do it. Thanks. i appreciate your help
(12 points each) 10. In dynamics course, a particle move in the elliptical slots due to the motion of the slotted link as shown on the figure. The normal acceleration of the particle is proportional to the velocity square over the radius of curvature (r). + y2 = 1000 _(1 + (x) 325 r(x) = — a) Calculated...
Please help me solve the bottom two question using Matlab and
show the steps to do it. Thanks. i appreciate your help
(12 points each) 10. In dynamics course, a particle move in the elliptical slots due to the motion of the slotted link as shown on the figure. The normal acceleration of the particle is proportional to the velocity square over the radius of curvature (r). + y2 = 1000 _(1 + (x) 325 r(x) = — a) Calculated...
 Please help me, my professor wants us to explain step by step each
problem but I cant! This is worth many points so please help me!
Thank you!
Writing Assignment 4 The following application and statements a., b., d., e., and f. can be found Sullivan's PreCalculus 9t www wennnnm edition pages 336-337. "A strain of E-coli SC18del-recA718 is placed into a nutrient broth at 30° Celsius and allowed to grow. The data given below are collected where x is...
Please help me, my professor wants us to explain step by step each
problem but I cant! This is worth many points so please help me!
Thank you!
Writing Assignment 4 The following application and statements a., b., d., e., and f. can be found Sullivan's PreCalculus 9t www wennnnm edition pages 336-337. "A strain of E-coli SC18del-recA718 is placed into a nutrient broth at 30° Celsius and allowed to grow. The data given below are collected where x is...
 I don’t think my graph is correct. Could someone compare and
help me figure out the answers for the next part?
Table 1: Data for Solenoid 1. Voltage (V) Current (A) B-Field (T) 0 0 0 0.2 0.11 0.39 0.6 0.27 0.95 1.0 0.51 1.86 1.3 0.75 2.71 1.6 0.96 3.5 1.9 1.25 4.5 2.5 1.48 5.7 1.6 . 1.4 y = 0.6236x -0.0431 R=0.9878 1.2 1 0.8 of current from 0 A to 1.5 A, recording the appropriate B-field...
I don’t think my graph is correct. Could someone compare and
help me figure out the answers for the next part?
Table 1: Data for Solenoid 1. Voltage (V) Current (A) B-Field (T) 0 0 0 0.2 0.11 0.39 0.6 0.27 0.95 1.0 0.51 1.86 1.3 0.75 2.71 1.6 0.96 3.5 1.9 1.25 4.5 2.5 1.48 5.7 1.6 . 1.4 y = 0.6236x -0.0431 R=0.9878 1.2 1 0.8 of current from 0 A to 1.5 A, recording the appropriate B-field...
 Hello, I have a lab that we have used bending sense in
our hand joint and we build a voltage decider to record voltage
change as angle of hand joint change as number (4) said : I did
record my values in a table1 below. However, I need help in number
(5). How would I plot these values in Matlab ? can some one help me
plotting what is asked in #5 ? I need help in this Matlab coding...
Hello, I have a lab that we have used bending sense in
our hand joint and we build a voltage decider to record voltage
change as angle of hand joint change as number (4) said : I did
record my values in a table1 below. However, I need help in number
(5). How would I plot these values in Matlab ? can some one help me
plotting what is asked in #5 ? I need help in this Matlab coding...
 can someone help me with this i am stuck with all these
questions i dont get it
Here are summary statistics for randomly selected weights of newborn girts: n = 155, X = 33.6 hg, 8 = 6.5 hg. Construct a confidence interval estimate of the mean. Use a 99% confidence level. Are these results very different from the confidence interval 31.3 hg <u <35.1 hg with only 13 sample values, x = 33.2 hg, and s = 2.3 hg?...
can someone help me with this i am stuck with all these
questions i dont get it
Here are summary statistics for randomly selected weights of newborn girts: n = 155, X = 33.6 hg, 8 = 6.5 hg. Construct a confidence interval estimate of the mean. Use a 99% confidence level. Are these results very different from the confidence interval 31.3 hg <u <35.1 hg with only 13 sample values, x = 33.2 hg, and s = 2.3 hg?...
Most questions answered within 3 hours.
-
1. When a nearsighted person looks at an object that is in the
distance with their...
asked 15 minutes ago -
QUESTION 8
Both of these statements will store the same value in the
variable $number
$number...
asked 39 minutes ago -
The price of 1 lb of potatoes is $1.75. If all the potatoes sold
today at...
asked 1 hour ago -
Garcia Company issues 20.00%, 15-year bonds with a par value of
$470,000 and semiannual interest payments....
asked 1 hour ago -
In C++ Programming, Try using loops only.
This lab demonstrates the use of the While Loop...
asked 2 hours ago -
Effect of DCMU and sodium azide on Chlamydomonas? We did an
experiment where we had Chlamydomonas...
asked 3 hours ago -
1a) According to the ideal gas law, _______________.
a. a gas has infinite volume at absolute...
asked 4 hours ago -
Oakdale Fashions, Inc. had $245,000 in 2018 taxable income.
Using the tax schedule in Table 2.3...
asked 4 hours ago -
The marketing class at CSUS had an average score of 150. An
educational analyst determined that...
asked 6 hours ago -
Justin Case has purchased a $250 000 home by putting 20 % down
and taking out...
asked 6 hours ago -
1. In a labor market, marginal cost for a firm is
____________.
a. recruiting cost
b....
asked 6 hours ago -
On January 1, 2019, ABC Company issued $60,000,000 of 20-year,
10.5% bonds when the market rate...
asked 7 hours ago