Assume that you are building a regression model of the form y = beta0 + beta1...
Assume that you are building a regression model of the
form
y = beta0 + beta1 x1 + beta2 x2 + beta3 x3 + E
where E is the random error term which is assumed to be normally
distributed with mean 0 and constant variance.
Data from 16 subjects are collected for the purpose of this study.
The R-Square value from the model is 0.60 and the total sums of
squares variation is 1000. What is the p-value of the Global Test
of Model Significance? Put your answer in 4 decimal places.
A regression model of the form y = beta0 + beta1 x1 + beta2 x2 + beta3 x3 + beta4 x4 + beta5 x5 + beta6 x6 + beta7 x7 + E is estimated. Here, E is assumed to be normally distributed with mean 0 and constant variance. You have been told that the R-Square value is 0.70, and that the Adj-R Square value is 0.60. What is the sample size?
Select one:
a. 29
b. 100
c. 19
d. Cannot be determined with the information given
e. 32
Homework Answers
First Solution:
Given in question:
n=16
R2 = 0.60
R =  0.60 = 0.77
using calculator:
p- value is = 0.0004.
Second Solution:
Use adjusted R2 Formula to calculate the sample size:

n-is sample size.
k-is number of predictor in model exclude the intercept.
Given in question:
R2 = 0.70 and Adjusted R2 = 0.60
put in formula to calculate the sample size.


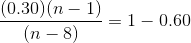

 (0.30)
(n-1) = 0.40 (n-8)
(0.30)
(n-1) = 0.40 (n-8)
0.30n - 0.30 = 0.40n - 3.2
0.40n - 0.30n = 3.2 - 0.30
0.1n = 2.9
n = 2.9 / 0.1
n = 2.9*10
n = 29
So Answere is (a). 29.
Add Answer to:
Assume that you are building a regression model of the
form
y = beta0 + beta1...
X1, X2, X3, X4,X5,X6,X7,X8 are independent identically distributed random variables. Their common distribution is normal with...
X1, X2, X3, X4,X5,X6,X7,X8 are independent identically distributed random variables. Their common distribution is normal with mean 0 and variance 4. Let W = X12+ X22 + X32 + X42+X52+X62+X72+X82 . Calculate Pr(W > 2)
Consider a multiple regression model of the dependent variable y on independent variables x1, X2, X3, and x4: Using data with n 60 observations for each of the variables, a student obtains the follow...
 Consider a multiple regression model of the dependent variable y on independent variables x1, X2, X3, and x4: Using data with n 60 observations for each of the variables, a student obtains the following estimated regression equation for the model given: y0.35 0.58x1 + 0.45x2-0.25x3 - 0.10x4 He would like to conduct significance tests for a multiple regression relationship. He uses the F test to determine whether a significant relationship exists between the dependent variable and He uses the t...
4. Testing for significance Aa Aa Consider a multiple regression model of the dependent variable y on independent variables x1, x2, X3, and x4: Using data with n = 60 observations for each of the var...
 4. Testing for significance Aa Aa Consider a multiple regression model of the dependent variable y on independent variables x1, x2, X3, and x4: Using data with n = 60 observations for each of the variables, a student obtains the following estimated regression equation for the model given: 0.04 + 0.28X1 + 0.84X2-0.06x3 + 0.14x4 y She would like to conduct significance tests for a multiple regression relationship. She uses the F test to determine whether a significant relationship exists...
A regression model was constructed by regressing Y on 5 explanatory variables, X1, X2, X3, X4,...
A regression model was constructed by regressing Y on 5 explanatory variables, X1, X2, X3, X4, and X5. There were n = 40 observations (rows) in the data set. In this case, the degrees of freedom (d.f.) for the error term in the model is:
Assume that vou build a multiple linear regression model using three independent predictor variables, You initialy...
 Assume that vou build a multiple linear regression model using three independent predictor variables, You initialy determine that X1 should be included in the model. You then test the other model combinations that indlude X1. Based on the results below, Which model would you choose and why? Std. Adj R Error Model R2 X1 0.85 0.841 2969.57 X1+X2 0,852 0.834 |3031.69 0.888 2491.95 0.902 0.884 2539.88 X1+X3 0.9 Full X1+X2. It has the lowest Adj R and the highest Standard...
All Greens is a franchise store that sells house plants and lawn and garden supplies. Although Al...
All Greens is a franchise store that sells house plants and lawn and garden supplies. Although All Greens is a franchise, each store is owned and managed by private individuals. Some friends have asked you to go into business with them to open a new All Greens store in the suburbs of San Diego. The national franchise headquarters sent you the following information at your request. These data are about 27 All Greens stores in California. Each of the 27...
The following data were collected on a simple random sample of 20 patients with hypertension: Y=m...
The following data were collected on a simple random sample of 20 patients with hypertension: Y=mean arterial blood pressure (mmHg), X1=age(years), X2= weight (kg), X3=body surface area (sq m), X4=duration of hypertension, X5 =basal pulse (beats/min), X6=measure of stress. A researcher is interested in developing a regression model to predict mean arterial blood pressure and has produced the following output: > rcorr(as.matrix(hyper)) Y X1 X2 X3 X4 X5 X6 Y 1.00 0.66 0.95 0.87 0.29 0.72 0.16 X1 0.66 1.00...
The following data were collected on a simple random sample of 20 patients with hypertension: Y=mean...
The following data were collected on a simple random sample of 20 patients with hypertension: Y=mean arterial blood pressure (mmHg), X1=age(years), X2= weight (kg), X3=body surface area (sq m), X4=duration of hypertension, X5 =basal pulse (beats/min), X6=measure of stress. A researcher is interested in developing a regression model to predict mean arterial blood pressure and has produced the following output: > rcorr(as.matrix(hyper)) Y X1 X2 X3 X4 X5 X6 Y 1.00 0.66 0.95 0.87 0.29 0.72 0.16 X1 0.66 1.00 0.41 0.38 0.34 0.62 0.37 X2 0.95 0.41...
All Greens is a franchise store that sells house plants and lawn and garden supplies. Although All Greens is a franchise, each store is owned and managed by private individuals. Some friends have aske...
All Greens is a franchise store that sells house plants and lawn and garden supplies. Although All Greens is a franchise, each store is owned and managed by private individuals. Some friends have asked you to go into business with them to open a new All Greens store in the suburbs of San Diego. The national franchise headquarters sent you the following information at your request. These data are about 27 All Greens stores in California. Each of the 27...
ek-tin Based on the following regression output, what proportion the total variation in Y is explained...
 ek-tin
Based on the following regression output, what proportion the total variation in Y is explained by X? Regression Statistics Multiple R 0.917214 R Square 0.841282 Adjusted R Square 0.821442 Standard Error 9.385572 Observations 10 ANOVA di SS MS Significance F 1 Regression 3735.3060 3735.30600 42.40379 0.000186 Residual 8 704.7117 88.08896 9 Total 4440.0170 Coefficients Standard Error t Stat P-value Lower 95% Intercept 31.623780 10.442970 3.028236 0.016353 7.542233 X Variable 1.131661 0.173786 6.511819 0.000186 0.730910 o a. 0.917214 o b.9.385572...
ek-tin
Based on the following regression output, what proportion the total variation in Y is explained by X? Regression Statistics Multiple R 0.917214 R Square 0.841282 Adjusted R Square 0.821442 Standard Error 9.385572 Observations 10 ANOVA di SS MS Significance F 1 Regression 3735.3060 3735.30600 42.40379 0.000186 Residual 8 704.7117 88.08896 9 Total 4440.0170 Coefficients Standard Error t Stat P-value Lower 95% Intercept 31.623780 10.442970 3.028236 0.016353 7.542233 X Variable 1.131661 0.173786 6.511819 0.000186 0.730910 o a. 0.917214 o b.9.385572...
 Consider a multiple regression model of the dependent variable y on independent variables x1, X2, X3, and x4: Using data with n 60 observations for each of the variables, a student obtains the following estimated regression equation for the model given: y0.35 0.58x1 + 0.45x2-0.25x3 - 0.10x4 He would like to conduct significance tests for a multiple regression relationship. He uses the F test to determine whether a significant relationship exists between the dependent variable and He uses the t...
 4. Testing for significance Aa Aa Consider a multiple regression model of the dependent variable y on independent variables x1, x2, X3, and x4: Using data with n = 60 observations for each of the variables, a student obtains the following estimated regression equation for the model given: 0.04 + 0.28X1 + 0.84X2-0.06x3 + 0.14x4 y She would like to conduct significance tests for a multiple regression relationship. She uses the F test to determine whether a significant relationship exists...
 Assume that vou build a multiple linear regression model using three independent predictor variables, You initialy determine that X1 should be included in the model. You then test the other model combinations that indlude X1. Based on the results below, Which model would you choose and why? Std. Adj R Error Model R2 X1 0.85 0.841 2969.57 X1+X2 0,852 0.834 |3031.69 0.888 2491.95 0.902 0.884 2539.88 X1+X3 0.9 Full X1+X2. It has the lowest Adj R and the highest Standard...
 ek-tin
Based on the following regression output, what proportion the total variation in Y is explained by X? Regression Statistics Multiple R 0.917214 R Square 0.841282 Adjusted R Square 0.821442 Standard Error 9.385572 Observations 10 ANOVA di SS MS Significance F 1 Regression 3735.3060 3735.30600 42.40379 0.000186 Residual 8 704.7117 88.08896 9 Total 4440.0170 Coefficients Standard Error t Stat P-value Lower 95% Intercept 31.623780 10.442970 3.028236 0.016353 7.542233 X Variable 1.131661 0.173786 6.511819 0.000186 0.730910 o a. 0.917214 o b.9.385572...
ek-tin
Based on the following regression output, what proportion the total variation in Y is explained by X? Regression Statistics Multiple R 0.917214 R Square 0.841282 Adjusted R Square 0.821442 Standard Error 9.385572 Observations 10 ANOVA di SS MS Significance F 1 Regression 3735.3060 3735.30600 42.40379 0.000186 Residual 8 704.7117 88.08896 9 Total 4440.0170 Coefficients Standard Error t Stat P-value Lower 95% Intercept 31.623780 10.442970 3.028236 0.016353 7.542233 X Variable 1.131661 0.173786 6.511819 0.000186 0.730910 o a. 0.917214 o b.9.385572...
Most questions answered within 3 hours.
-
1.
You need to prepare 10.0 liters of an acid aqueous solution with a
pH of...
asked 7 seconds ago -
Along an aggregate supply curve, if the level of output is less
than the natural level...
asked 51 seconds ago -
By 2025, annual consumption in emerging markets will total $30
trillion and contribute more than ________...
asked 5 minutes ago -
At what point does reformation cease to be a viable option for
those who are oppressed...
asked 9 minutes ago -
When rolling a die 129 times, what is the probability of rolling
a 6 no more...
asked 8 minutes ago -
Place letters corresponding to amounts in the proper order for
lightest to heaviest samples:
a) 2100...
asked 14 minutes ago -
Consider the multicore processor with 6 heterogeneous cores
labelled C1, C2, C3, C4, C5, and C6....
asked 16 minutes ago -
Document system components according to standards and procedures
(Implement and hand over system components) IT administrative
asked 17 minutes ago -
The college asked 700 students if they wanted a longer spring
break and 600 students said...
asked 16 minutes ago -
Determine the temperature (in Celsius) at which 1.00 mole of an
ideal gas will have a...
asked 41 minutes ago -
Japan’s combination of X and Y
Canada’s combination of X and Y
100x and 0y
50x...
asked 33 minutes ago -
[1] Household statistics include individuals living alone or in
groups in:
A) apartments.
B) military barracks....
asked 44 minutes ago