For each of the following events, explain the short-run and long-run effects on output and the...
For each of the following events, explain the short-run and long-run effects on output and the price level, assuming policymakers take no action.
Answer the questions using sticky-wage theory.
a) The stock market declines sharply, reducing consumer’s wealth.
b) Now suppose that a stock market crash causes aggregate demand to fall. Use your diagram to show what happens to output and the price level in the short run. What happens to the unemployment rate?
c) A recessions overseas causes foreigners to buy fewer U.S. goods.
Homework Answers
a) When the stock market declines sharply, wealth declines, so the aggregate-demand curve shifts to the left. In the short run, the economy moves declines from point E to point E1, as output declines and the price level declines. In the long run, the short-run aggregate-supply curve shifts to the right to restore equilibrium at point with unchanged output and a lower price level compared to the original point i.e, point E2.
**Graph is same for a and b**
b) When the stock market collapse, People loose money as a result income of people fall and aggregate demand fall. As a result short run output fall and also price fall( As SRAS1 intersect with AD2), new equilibrium is at E1.
Now the output is less than the potential output, so unemployment rate will rise above the natural unemployment rate.
Using sticky wage theory, nominal wages are unchanged as the price level falls, firms will be forced to cut back on employment and production.Over time as expectations adjust, the short-run aggregate-supply curve will shift to the right, moving the economy back to the natural rate of output.
In the long run SRAS shift to the right to SRAS2 and the new equilibrium at E2.
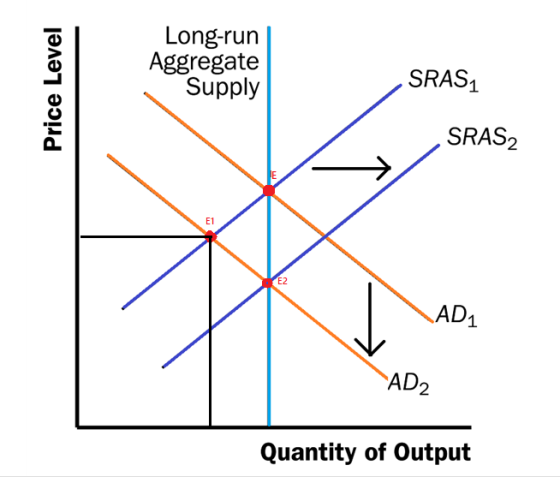
c) When a recession overseas causes foreigners to buy fewer U.S. goods, net exports decline, so the aggregate-demand curve shifts to the left, as shown in the figure. In the short run, the economy moves from point A to point B, as output declines and the price level declines. In the long run, the short-run aggregate-supply curve shifts to the right to restore equilibrium at point C, with unchanged output and a lower price level compared to point A.

Add Answer to:
For each of the following events, explain the short-run and
long-run effects on output and the...
1. For each of the following events, explain the short-run and long-run effects on output and...
1. For each of the following events, explain the short-run and long-run effects on output and price level, assuming policymakers take no action. a. The stock market declines sharply, reducing consumers’ wealth. b. The federal government increases spending on national defense. c. A technological improvement raises productivity. d. A recession overseas causes foreigners to buy fewer U.S. goods. e. Household decide to save a larger share of their income. f. Increased job opportunities overseas cause many people to leave the...
V. For each of the following four events (a-d, below), explain the short-run effects on U.S....
 V. For each of the following four events (a-d, below), explain the short-run effects on U.S. output and the price level, assuming policymakers take no action. Please use a separate graph to illustrate each answer. EACH written answer should address: 1) WHICH curve AD, SRAS and/or LRAS is affected. (No explanation required). ***2)WHY the curve shifts (which determinant is responsible) EXPLAIN fully. 20:83)HOW (increase or decrease) the event described affects AD and/or SRAS and/or LRAS. No explanation required. 4) What...
8. Economic fluctuations I The following graph shows the economy in long-run equilibrium at the e...
 8. Economic fluctuations I The following graph shows the economy in long-run equilibrium at the expected price level of 120 and the natural level of output of $600 billion. Suppose a stock market boom increases household wealth and causes consumers to spend more. Shift the short-run aggregate supply (AS) curve or the aggregate demand (AD) curve to show the short-run impact of the stock market boom. In the short run, the increase in consumption spending associated with the stock market expansion causes the...
2. Match the following terms with their definitions Answers Misperceptions Theory Exchange-rate effect Interest-rate effect Sticky-Wage Theory Full-employment output Options The production of goo...
 2. Match the following terms with their definitions Answers Misperceptions Theory Exchange-rate effect Interest-rate effect Sticky-Wage Theory Full-employment output Options The production of goods and services that an economy achieves in the long run when unemployment is at its normal rate a. b. The short-run aggregate supply curve slopes upward because nominal wages are slow to adjust to changing economic conditions. When a fall in the U.S. price level causes U.S. interest rates to fall, the real value of the...
IV. Suppose an economy is in long run equilibrium. (a) Use the model of aggregate demand...
 IV. Suppose an economy is in long run equilibrium. (a) Use the model of aggregate demand and aggregate supply to illustrate the initial equilibrium on a BIG and clearly labeled graph. Label the equilibrium point A. Be sure to include the short-run and long-run aggregate supply. (b) Household spending increases. Use your diagram to show what happens to output and the price level as the economy moves from the initial to the new short-run equilibrium (label it point B) (c)...
The following graph shows the economy in long-run equilibrium atthe expected price level of 120...
 The following graph shows the economy in long-run equilibrium at
the expected price level of 120 and the natural level of output of
$600 billion. Suppose a sudden and severe contraction in the
housing market reduces the value of homes and causes consumers to
spend less.Shift the short-run aggregate supply (AS) curve or the aggregate
demand (AD) curve to show the short-run impact of
the housing market slump.In the short run, the decrease in consumption spending
associated with the housing...
The following graph shows the economy in long-run equilibrium at
the expected price level of 120 and the natural level of output of
$600 billion. Suppose a sudden and severe contraction in the
housing market reduces the value of homes and causes consumers to
spend less.Shift the short-run aggregate supply (AS) curve or the aggregate
demand (AD) curve to show the short-run impact of
the housing market slump.In the short run, the decrease in consumption spending
associated with the housing...
7. Most economists believe that prices are: a) flexible in the short run but many are sticky in the long run. b) flexibl...
7. Most economists believe that prices are: a) flexible in the short run but many are sticky in the long run. b) flexible in the long run but many are stick in the short run. c) sticky in both the short and long runs. d) flexible in both the short and long runs. 8. If the short run aggregate supply curve is horizontal, then changes in aggregate demand affect: a) level of output but not prices. b) prices but not...
If the short-run aggregate supply decreases by more than the long-run aggregate supply, then, at the...
 If the short-run aggregate supply decreases by more than the long-run aggregate supply, then, at the short-run equilibrium, a) Output will be equal to its natural level. b) Output will be above its natural level. O c) Unemployment will be equal to the natural rate of unemployment. d) Output will be below its natural level. Facebl» wides anಂಕು Suppose the economy is at point C. If investment spending decreases in the economy, where will the eventual long-run equilibrium be? a)...
Explain what happens to the inflation, unemployment, and output gap in the short run in each...
Explain what happens to the inflation, unemployment, and output gap in the short run in each of the following circumstances. do not need to graph but explain which part of IS/MP/PC is affected and why. 1.There is deep recession in China. 2.The stock market crashes and causes consumers to lose confidence in the economy.
Economics chart The following graph shows the economy in long-run equilibrium at the price level of...
 Economics chart The following graph shows the economy in long-run equilibrium at the price level of 120 and potential output of $300 billion. Suppose several foreign economies experience severe recessions, causing foreign purchases of domestic goods and services to decline sharply. Shift the short-run aggregate supply (AS) curve or the aggregate demand (AD) curve to show the short-run impact of the economic turmoil abroad. Tool tip: Click and drag one or both of the curves. Curves will snap into position, so if...
 V. For each of the following four events (a-d, below), explain the short-run effects on U.S. output and the price level, assuming policymakers take no action. Please use a separate graph to illustrate each answer. EACH written answer should address: 1) WHICH curve AD, SRAS and/or LRAS is affected. (No explanation required). ***2)WHY the curve shifts (which determinant is responsible) EXPLAIN fully. 20:83)HOW (increase or decrease) the event described affects AD and/or SRAS and/or LRAS. No explanation required. 4) What...
 2. Match the following terms with their definitions Answers Misperceptions Theory Exchange-rate effect Interest-rate effect Sticky-Wage Theory Full-employment output Options The production of goods and services that an economy achieves in the long run when unemployment is at its normal rate a. b. The short-run aggregate supply curve slopes upward because nominal wages are slow to adjust to changing economic conditions. When a fall in the U.S. price level causes U.S. interest rates to fall, the real value of the...
 IV. Suppose an economy is in long run equilibrium. (a) Use the model of aggregate demand and aggregate supply to illustrate the initial equilibrium on a BIG and clearly labeled graph. Label the equilibrium point A. Be sure to include the short-run and long-run aggregate supply. (b) Household spending increases. Use your diagram to show what happens to output and the price level as the economy moves from the initial to the new short-run equilibrium (label it point B) (c)...
 The following graph shows the economy in long-run equilibrium at
the expected price level of 120 and the natural level of output of
$600 billion. Suppose a sudden and severe contraction in the
housing market reduces the value of homes and causes consumers to
spend less.Shift the short-run aggregate supply (AS) curve or the aggregate
demand (AD) curve to show the short-run impact of
the housing market slump.In the short run, the decrease in consumption spending
associated with the housing...
The following graph shows the economy in long-run equilibrium at
the expected price level of 120 and the natural level of output of
$600 billion. Suppose a sudden and severe contraction in the
housing market reduces the value of homes and causes consumers to
spend less.Shift the short-run aggregate supply (AS) curve or the aggregate
demand (AD) curve to show the short-run impact of
the housing market slump.In the short run, the decrease in consumption spending
associated with the housing...
 If the short-run aggregate supply decreases by more than the long-run aggregate supply, then, at the short-run equilibrium, a) Output will be equal to its natural level. b) Output will be above its natural level. O c) Unemployment will be equal to the natural rate of unemployment. d) Output will be below its natural level. Facebl» wides anಂಕು Suppose the economy is at point C. If investment spending decreases in the economy, where will the eventual long-run equilibrium be? a)...
Most questions answered within 3 hours.
-
The extent to which assets are financed by borrowed funds and
other liabilities is indicated by:...
asked 46 minutes ago -
Explain in detail
Germany is the fifth largest economy
explain what goods and services Germany specializes...
asked 1 hour ago -
The density of platinum is 21.45 g/mL. If a cube of platinum
with a mass of...
asked 1 hour ago -
Accounts Receivable
Sales
A/R Posting
Extended Sales Invoice
Packing Slip
Compare invoice to packing slip 2...
asked 1 hour ago -
Michaella, age 23, is a full-time law student and is claimed by
her parents as a...
asked 1 hour ago -
Why are polymers not typically casted into products?
asked 1 hour ago -
When rolling a die 129 times, what is the probability of rolling
a 6 no more...
asked 1 hour ago -
4. A call option currently sells for $7.75. It has a strike
price of $85 and...
asked 1 hour ago -
1.
You need to prepare 10.0 liters of an acid aqueous solution with a
pH of...
asked 1 hour ago -
Along an aggregate supply curve, if the level of output is less
than the natural level...
asked 1 hour ago -
By 2025, annual consumption in emerging markets will total $30
trillion and contribute more than ________...
asked 1 hour ago -
At what point does reformation cease to be a viable option for
those who are oppressed...
asked 1 hour ago