What percent of a standard normal distribution is found in each region below? Be sure to...
What percent of a standard normal distribution is found in each region below? Be sure to draw a graph
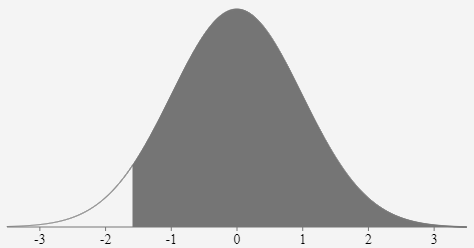
a) Z>-1.59
b) -0.4<z<1.8
Homework Answers
Part a)
P ( Z > -1.59 ) = 1 - P ( Z < -1.59 )
P ( Z > -1.59 ) = 1 - 0.0559
P ( Z > -1.59 ) = 0.9441
Part b)
P ( -0.4 < Z < 1.8 ) = P ( Z < 1.8 ) - P ( Z < -0.4
)
P ( -0.4 < Z < 1.8 ) = 0.9641 - 0.3446
P ( -0.4 < Z < 1.8 ) = 0.6195

Add Answer to:
What percent of a standard normal distribution is found in each
region below? Be sure to...
What percent of a standard normal distribution N(µ = 0,σ = 1) is found in each...
What percent of a standard normal distribution N(µ = 0,σ = 1) is found in each region? Be sure to draw a graph. A. |Z| > 2
10. What percent of a standard Normal model is found in each region? Draw a picture...
 10. What percent of a standard Normal model is found in each region? Draw a picture first. a) z2.05 b) z<-0.33 c) 1.2 <z 1.8 d) z<1.28 6. The pediatrician in Exercise 4 explains to the parents that the most extreme 5% of cases often require special treatment or attention. a) Does this child fall into that group? b) What do you need to assume about the heights of 2-year-olds to find your answer to part a?
Below is a graph of a normal distribution with mean -4 and standard deviation o 3....
 Below is a graph of a normal distribution with mean -4 and standard deviation o 3. The shaded region represents the probability of obtaining a value from this distribution that is less than 5.5. 0.4 0.3 0.2 0.1- - 5.5 -4 Shade the corresponding region under the standard normal density curve below 0.4 ? 0.3 0.2 0.1
(1 point) Find the Z-score from the standard normal distribution that satisfies each of the following...
 (1 point) Find the Z-score from the standard normal distribution that satisfies each of the following statements. Draw an appropriate diagram, shade the appropriate region that represents for each Z-scores. Round your answers to 2 decimal places. (a) The point z with 5.05 percent of the observations falling below it. ZE (b) The closest point z with 7.68 percent of the observations falling above it. z =
Find the area of the shaded region. The graph depicts the standard normal distribution with mean...
Find the area of the shaded region. The graph depicts the standard normal distribution with mean 0 and standard deviation 1. Click to view page 1 of the table. LOADING... Click to view page 2 of the table. LOADING... z equals 0.88 A graph with a bell-shaped curve, divided into 2 regions by a line from top to bottom on the right side. The region left of the line is shaded. The z-axis below the line is labeled "z=0.88". The...
Find the area of the shaded region. The graph depicts the standard normal distribution with...
 Find the area of the shaded region. The graph depicts the standard normal distribution with mean 0 and standard deviation 1. z = 0.45 The area of the shaded region is _______ (Round to four decimal places as needed.)
Consider a standard normal distribution (a mean of zero and a standard deviation of 1.) What...
Consider a standard normal distribution (a mean of zero and a standard deviation of 1.) What percentage of this distribution is found in each of the following regions? Select the most apropriate answer from the drop down list. Region: Z > -1.13 87 20 0 % (options are 87,20, or 0) Region: Z < 0.18 81 71 57 % (options are 81,71, or 57) Region: Z > 8 0 16 99 % (options are 0, 16, or 99) Region: |Z| < 0.5 100 38...
find the area of the shaded region. the graph depicts the standard normal distribution Find the...
 find the area of the shaded region. the graph depicts the
standard normal distribution
Find the area of the shaded region. The graph depicts the standard deviation 1. normal distribution with mean 0 and standar 1) 1) 1.13 226 339 -3.39 -226 -1.13 B) 0.1292 C) 0.8708 D) 0.8907 A) 0.8485 2) 2) Round to four decimal places. 2.95-2.36-1.77-1.18-059 059 1.18 1.77 236 3) Round to four decimal places. 3) -2.16 -1.08 1.08 216 Find the indicated z score. The...
find the area of the shaded region. the graph depicts the
standard normal distribution
Find the area of the shaded region. The graph depicts the standard deviation 1. normal distribution with mean 0 and standar 1) 1) 1.13 226 339 -3.39 -226 -1.13 B) 0.1292 C) 0.8708 D) 0.8907 A) 0.8485 2) 2) Round to four decimal places. 2.95-2.36-1.77-1.18-059 059 1.18 1.77 236 3) Round to four decimal places. 3) -2.16 -1.08 1.08 216 Find the indicated z score. The...
3. The shaded region represents the Below is a graph of a normal distribution with mean 1 -1 and standard deviation...
 3. The shaded region represents the Below is a graph of a normal distribution with mean 1 -1 and standard deviation probability of obtaining a value from this distribution that is between 0.5 and 3.5. Shade the corresponding region under the standard normal density curve below. x 6 ?
Find the area of the shaded region. The graph depicts the standard normal distribution of bone...
Find the area of the shaded region. The graph depicts the standard normal distribution of bone density scores with mean 0 and standard deviation 1. z=-0.83 z=1.26
 10. What percent of a standard Normal model is found in each region? Draw a picture first. a) z2.05 b) z<-0.33 c) 1.2 <z 1.8 d) z<1.28 6. The pediatrician in Exercise 4 explains to the parents that the most extreme 5% of cases often require special treatment or attention. a) Does this child fall into that group? b) What do you need to assume about the heights of 2-year-olds to find your answer to part a?
 Below is a graph of a normal distribution with mean -4 and standard deviation o 3. The shaded region represents the probability of obtaining a value from this distribution that is less than 5.5. 0.4 0.3 0.2 0.1- - 5.5 -4 Shade the corresponding region under the standard normal density curve below 0.4 ? 0.3 0.2 0.1
 (1 point) Find the Z-score from the standard normal distribution that satisfies each of the following statements. Draw an appropriate diagram, shade the appropriate region that represents for each Z-scores. Round your answers to 2 decimal places. (a) The point z with 5.05 percent of the observations falling below it. ZE (b) The closest point z with 7.68 percent of the observations falling above it. z =
 find the area of the shaded region. the graph depicts the
standard normal distribution
Find the area of the shaded region. The graph depicts the standard deviation 1. normal distribution with mean 0 and standar 1) 1) 1.13 226 339 -3.39 -226 -1.13 B) 0.1292 C) 0.8708 D) 0.8907 A) 0.8485 2) 2) Round to four decimal places. 2.95-2.36-1.77-1.18-059 059 1.18 1.77 236 3) Round to four decimal places. 3) -2.16 -1.08 1.08 216 Find the indicated z score. The...
find the area of the shaded region. the graph depicts the
standard normal distribution
Find the area of the shaded region. The graph depicts the standard deviation 1. normal distribution with mean 0 and standar 1) 1) 1.13 226 339 -3.39 -226 -1.13 B) 0.1292 C) 0.8708 D) 0.8907 A) 0.8485 2) 2) Round to four decimal places. 2.95-2.36-1.77-1.18-059 059 1.18 1.77 236 3) Round to four decimal places. 3) -2.16 -1.08 1.08 216 Find the indicated z score. The...
 3. The shaded region represents the Below is a graph of a normal distribution with mean 1 -1 and standard deviation probability of obtaining a value from this distribution that is between 0.5 and 3.5. Shade the corresponding region under the standard normal density curve below. x 6 ?
Most questions answered within 3 hours.
-
Myca Corp. has a project with the following cash flows. What is
the value of the...
asked 1 hour ago -
When an object moves through a fluid, the fluid exerts a viscous
force F on the...
asked 3 hours ago -
Why did the observed chemistry of thallium mislead Mendelev to
place the group 13 element (Tl)...
asked 4 hours ago -
A sine wave signal is displayed on the screen of an
oscilloscope. 6 peak-to-peak divisions are...
asked 6 hours ago -
a
1500 kg car accelerates from 0 to 25 m / s in 21.0s. How much...
asked 8 hours ago -
Calculate the molarity of each of the following solutions:
(a) 30.5 g of ethanol (C2H5OH) in...
asked 7 hours ago -
1 Refer to the build-borrow-or-buy framework as a decision tree
for the Adidas company. Identify a...
asked 8 hours ago -
Problem 2: The Problem of Social Cost. A Rancher and Farmer live
side-by-side to each other....
asked 9 hours ago -
a uniform bar of weight 40N is 4 meter long. weights
on 60N and 100N are...
asked 9 hours ago -
Define Diet counceling? What are the
responsibilities of a counselor?
asked 11 hours ago -
Hey im just confused about how to put the ' A angle n' and ' S...
asked 11 hours ago -
A short essay about the WSJ article on Oreo versus Hydrox.
asked 11 hours ago