The authors of a paper studied a random sample of 346 Twitter users. For each Twitter...
The authors of a paper studied a random sample of 346 Twitter users. For each Twitter user in the sample, the tweets sent during a particular time period were analyzed and the Twitter user was classified into one of the following categories based on the type of messages they usually sent.
| Category | Description |
|---|---|
| IS | Information sharing |
| OC | Opinions and complaints |
| RT | Random thoughts |
| ME | Me now (what I am doing now) |
| O | Other |
The accompanying table gives the observed counts for the five categories (approximate values read from a graph in the paper).
| Twitter Type | IS | OC | RT | ME | O |
|---|---|---|---|---|---|
| Observed count | 51 | 60 | 62 | 99 | 74 |
Carry out a hypothesis test to determine if there is convincing evidence that the proportions of Twitter users falling into each of the five categories are not all the same. Use a significance level of α = 0.05.
Let p1, p2, p3, p4, and p5 be the proportions of Twitter users falling into the five categories.
State the appropriate null and alternative hypotheses.
H0: p1 =
p2 = p3 =
p4 = p5 = 0.5
Ha: H0 is not
true.
H0: p1 =
p2 = p3 =
p4 = p5 = 346
Ha: H0 is not
true.
H0: p1 =
p2 = p3 =
p4 = p5 = 0.2
Ha: H0 is not
true.
H0: p1 =
p2 = p3 =
p4 = p5 = 70
Ha: H0 is not
true.
H0: p1 =
p2 = p3 =
p4 = p5 = 0.05
Ha: H0 is not
true.
Find the test statistic and P-value. (Use technology. Round your test statistic to three decimal places and your P-value to four decimal places.)
X2=
P-value=
State the conclusion in the problem context.
Do not reject H0. There is convincing evidence to conclude that the proportions of Twitter users falling into the five categories are not all the same.
Do not reject H0. There is not convincing evidence to conclude that the proportions of Twitter users falling into the five categories are not all the same.
Reject H0. There is not convincing evidence to conclude that the proportions of Twitter users falling into the five categories are not all the same.
Reject H0. There is convincing evidence to conclude that the proportions of Twitter users falling into the five categories are not all the same.
Homework Answers
Claim: There is convincing evidence that the proportions of Twitter users falling into each of the five categories are not all the same.
p = 1 / 5 = 0.2
The null and alternative hypothesis is
H0: p1 =
p2 = p3 =
p4 = p5 = 0.2
Ha: H0 is not
true.
Test statistic is
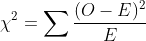
O: Observed frequency
E: Expected frequency.
E = n*p
n = 346
| O | E | (O-E) | (O-E)^2 | (O-E)^2/E | |
| 51 | 69.2 | -18.2 | 331.24 | 4.786705 | |
| 60 | 69.2 | -9.2 | 84.64 | 1.223121 | |
| 62 | 69.2 | -7.2 | 51.84 | 0.749133 | |
| 99 | 69.2 | 29.8 | 888.04 | 12.83295 | |
| 74 | 69.2 | 4.8 | 23.04 | 0.332948 | |
| Total | 346 | 19.925 |

Degrees of freedom = Number of E's - 1 = 5 - 1 = 4
P-value = P( )
= 0.0005
)
= 0.0005
P-value < 0.05 we reject null hypothesis.
Reject H0. There is convincing evidence to conclude that the proportions of Twitter users falling into the five categories are not all the same.
Add Answer to:
The authors of a paper studied a random sample of 346 Twitter
users. For each Twitter...
Birds use color to select and avoid certain types of food. The authors of a particular...
Birds use color to select and avoid certain types of food. The authors of a particular article studied the pecking behavior of 1-day-old bobwhites. In an area painted white, they inserted four pins with different colored heads. The color of the pin chosen on the bird's first peck was noted for each of 35 bobwhites, resulting in the accompanying table. Color First Peck Frequency Blue 15 Green 9 Yellow 7 Red 4 Do these data provide evidence of a color...
Birds use color to select and avoid certain types of food. The authors of a particular...
 Birds use color to select and avoid certain
types of food. The authors of a particular article studied the
pecking behavior of 1-day-old bobwhites. In an area painted white,
they inserted four pins with different colored heads. The color of
the pin chosen on the bird's first peck was noted for each of 33
bobwhites, resulting in the accompanying table. Color First Peck
Frequency Blue 15 Green 8 Yellow 7 Red 3 Do these data provide
evidence of a color...
Birds use color to select and avoid certain
types of food. The authors of a particular article studied the
pecking behavior of 1-day-old bobwhites. In an area painted white,
they inserted four pins with different colored heads. The color of
the pin chosen on the bird's first peck was noted for each of 33
bobwhites, resulting in the accompanying table. Color First Peck
Frequency Blue 15 Green 8 Yellow 7 Red 3 Do these data provide
evidence of a color...
The authors of a paper classified characters who were depicted smoking in movies released between a...
The authors of a paper classified characters who were depicted smoking in movies released between a certain range of years. The smoking characters were classified according to sex and whether the character type was positive, negative, or neutral. The resulting data is given in the accompanying table. Assume that it is reasonable to consider this sample of smoking movie characters as representative of smoking movie characters. Do the data provide evidence of an association between sex and character type for...
In a study of high-achieving high school graduates, the authors of a report surveyed 834 high...
In a study of high-achieving high school graduates, the authors of a report surveyed 834 high school graduates who were considered "academic superstars" and 434 graduates who were considered "solid performers." One question on the survey asked the distance from their home to the college they attended. Assuming it is reasonable to regard these two samples as random samples of academic superstars and solid performers nationwide, use the accompanying data to determine if it is reasonable to conclude that the...
Each person in a large sample of German adolescents was asked to indicate which of 50...
Each person in a large sample of German adolescents was asked to indicate which of 50 popular movies they had seen in the past year. Based on the response, the amount of time (in minutes) of alcohol use contained in the movies the person had watched was estimated. Each person was then classified into one of four groups based on the amount of movie alcohol exposure (groups 1, 2, 3, and 4, with 1 being the lowest exposure and 4...
A particular article reported the accompanying data on phenotypes resulting from crossing tall cut-leaf tomatoes with...
A particular article reported the accompanying data on phenotypes resulting from crossing tall cut-leaf tomatoes with dwarf potato-leaf tomatoes. There are four possible phenotypes: (1) tall cut-leaf, (2) tall potato-leaf, (3) dwarf cut-leaf, and (4) dwarf potato-leaf. Phenotype 1 2 3 4 Frequency 926 288 295 101 Mendel's laws of inheritance imply that p1 = 9/16, p2 = 3/16 , p3 = 3/16 , and p4 = 1/16 State the appropriate null and alternative hypotheses.. Are the data from this...
Some colleges now allow students to pay their tuition using a credit card. A report includes...
Some colleges now allow students to pay their tuition using a credit card. A report includes data from a survey of 100 public 4-year colleges, 100 private 4-year colleges, and 100 community colleges. The accompanying table gives information on credit card acceptance for each of these samples of colleges. Accepts Credit Cards for Tuition Payment Does Not Accept Credit Cards for Tuition Payment Public 4-Year Colleges 90 10 Private 4-Year Colleges 65 35 Community Colleges 100 0 For purposes of...
A paper described a survey of 500 undergraduate students at a state university in the southwestern...
A paper described a survey of 500 undergraduate students at a state university in the southwestern region of the United States. Each student in the sample was classified according to class standing (freshman, sophomore, junior, or senior) and body art category (body piercings only, tattoos only, both tattoos and body piercings, no body art). Use the data in the accompanying table to determine if there is evidence that there is an association between class standing and response to the body...
Questions 15-16: In an article, the authors compare the use of humor in TV ads in...
 Questions 15-16: In an article, the authors compare the use of humor in TV ads in the United States and in the United Kingdom. A random sample of 100 TV ads in the United States reveals that 45 use humor, while a random sample of 120 TV ads in the United Kingdom reveals that 35 use humor. Let pi and p2 represent the true proportion of ads using humor in the United States and in the United Kingdom respectively. If...
A paper described a survey of 497 undergraduate students at a state university in the southwestern...
 A paper described a survey of 497 undergraduate students at a state university in the southwestern region of the United States. Each student in the sample was classified according to class standing (freshman, sophomore, junior, or senior) and body art category (body piercings only, tattoos only both tattoos and body piercings, no body art). Use the data in the accompanying table to determine if there is evidence that there is an association between class standing and response to the body...
 Birds use color to select and avoid certain
types of food. The authors of a particular article studied the
pecking behavior of 1-day-old bobwhites. In an area painted white,
they inserted four pins with different colored heads. The color of
the pin chosen on the bird's first peck was noted for each of 33
bobwhites, resulting in the accompanying table. Color First Peck
Frequency Blue 15 Green 8 Yellow 7 Red 3 Do these data provide
evidence of a color...
Birds use color to select and avoid certain
types of food. The authors of a particular article studied the
pecking behavior of 1-day-old bobwhites. In an area painted white,
they inserted four pins with different colored heads. The color of
the pin chosen on the bird's first peck was noted for each of 33
bobwhites, resulting in the accompanying table. Color First Peck
Frequency Blue 15 Green 8 Yellow 7 Red 3 Do these data provide
evidence of a color...
 Questions 15-16: In an article, the authors compare the use of humor in TV ads in the United States and in the United Kingdom. A random sample of 100 TV ads in the United States reveals that 45 use humor, while a random sample of 120 TV ads in the United Kingdom reveals that 35 use humor. Let pi and p2 represent the true proportion of ads using humor in the United States and in the United Kingdom respectively. If...
 A paper described a survey of 497 undergraduate students at a state university in the southwestern region of the United States. Each student in the sample was classified according to class standing (freshman, sophomore, junior, or senior) and body art category (body piercings only, tattoos only both tattoos and body piercings, no body art). Use the data in the accompanying table to determine if there is evidence that there is an association between class standing and response to the body...
Most questions answered within 3 hours.
-
Green Tree Corporation is expecting to receive $0.5 million at
the end of Year 1, $0.25...
asked 18 minutes ago -
A face value of $10,000 is assumed for these Treasury bills.
Maturity Days to Maturity Bank...
asked 14 minutes ago -
Complete and balance the following methesis reaction in aqueous
solution.
Instructions
• Use proper element capitalization....
asked 9 minutes ago -
Please read the article attached.Under Armour Is Subject of
Federal Accounting Probes - WSJ.pdf Under Armour,...
asked 11 minutes ago -
An increase in income will usually shift out the demand for a
product.
Group of answer...
asked 16 minutes ago -
What is the correct unit of the spring constant k?
A- N m
B- J/m
C-...
asked 26 minutes ago -
A manufacturing company prepays its insurance coverage for a
three-year period. The premium for the three...
asked 30 minutes ago -
What is the other name for Shortest Job First Preemptive
Algorithm?
What are the 5 different...
asked 43 minutes ago -
24) An outbreak due to exposure of a group of persons to the
same harmful influence...
asked 52 minutes ago -
Show the calculation of (1) the expected grams of alum
(KAl(SO4)2 •12 H2O) formed from the...
asked 55 minutes ago -
*There are two different answers posted. Other students
were asked the same question. Which response is...
asked 1 hour ago -
Data is collected on the relationship between time spent playing
video games and time spent with...
asked 1 hour ago