In a study of high-achieving high school graduates, the authors of a report surveyed 834 high...
In a study of high-achieving high school graduates, the authors
of a report surveyed 834 high school graduates who were considered
"academic superstars" and 434 graduates who were considered "solid
performers." One question on the survey asked the distance from
their home to the college they attended.
Assuming it is reasonable to regard these two samples as random
samples of academic superstars and solid performers nationwide, use
the accompanying data to determine if it is reasonable to conclude
that the distribution of responses over the distance from home
categories is not the same for academic superstars and solid
performers. Use
α = 0.05.
| Distance of College from Home (in miles) | |||||
|---|---|---|---|---|---|
| Student Group | Less than 40 |
40 to 99 |
100 to 199 |
200 to 399 |
400 or More |
| Academic Superstars | 158 | 157 | 143 | 151 | 225 |
| Solid Performers | 104 | 94 | 83 | 66 | 87 |
State the null and alternative hypotheses.
H0: The proportions falling into the
distance categories are not all the same for the two student
groups.
Ha: The proportions falling into the
distance categories are the same for the two student
groups.H0: Student group and distance of
college from home are independent.
Ha: Student group and distance of
college from home are not
independent. H0: Student
group and distance of college from home are not independent.
Ha: Student group and distance of
college from home are independent.H0: The
proportions falling into the distance categories are the same for
the two student groups.
Ha: The proportions falling into the
distance categories are not all the same for the two student
groups.
Calculate the test statistic. (Round your answer to two decimal
places.)
χ2 =
What is the P-value for the test? (Round your answer to
four decimal places.)
P-value =
What can you conclude?
Reject H0. There is convincing evidence to conclude that the proportions falling into the distance categories are not all the same for the two student groups.Do not reject H0. There is not enough evidence to conclude that the proportions falling into the distance categories are not all the same for the two student groups. Do not reject H0. There is not enough evidence to conclude that there is an association between student group and distance of college from home.Reject H0. There is convincing evidence to conclude that there is an association between student group and distance of college from home.
Homework Answers
The statistical software output for this problem is :
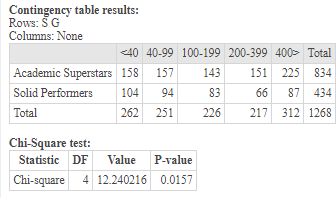
Test statistics  = 12.24
P-value = 0.0157
.Reject H0. There is convincing evidence to conclude that there is an association between student group and distance of college from home.
Add Answer to:
In a study of high-achieving high school graduates, the authors
of a report surveyed 834 high...
The authors of a paper classified characters who were depicted smoking in movies released between a...
The authors of a paper classified characters who were depicted smoking in movies released between a certain range of years. The smoking characters were classified according to sex and whether the character type was positive, negative, or neutral. The resulting data is given in the accompanying table. Assume that it is reasonable to consider this sample of smoking movie characters as representative of smoking movie characters. Do the data provide evidence of an association between sex and character type for...
Each person in a large sample of German adolescents was asked to indicate which of 50...
Each person in a large sample of German adolescents was asked to indicate which of 50 popular movies they had seen in the past year. Based on the response, the amount of time (in minutes) of alcohol use contained in the movies the person had watched was estimated. Each person was then classified into one of four groups based on the amount of movie alcohol exposure (groups 1, 2, 3, and 4, with 1 being the lowest exposure and 4...
The authors of a paper studied a random sample of 346 Twitter users. For each Twitter...
The authors of a paper studied a random sample of 346 Twitter users. For each Twitter user in the sample, the tweets sent during a particular time period were analyzed and the Twitter user was classified into one of the following categories based on the type of messages they usually sent. Category Description IS Information sharing OC Opinions and complaints RT Random thoughts ME Me now (what I am doing now) O Other The accompanying table gives the observed counts...
A paper described a survey of 500 undergraduate students at a state university in the southwestern...
A paper described a survey of 500 undergraduate students at a state university in the southwestern region of the United States. Each student in the sample was classified according to class standing (freshman, sophomore, junior, or senior) and body art category (body piercings only, tattoos only, both tattoos and body piercings, no body art). Use the data in the accompanying table to determine if there is evidence that there is an association between class standing and response to the body...
Some colleges now allow students to pay their tuition using a credit card. A report includes...
Some colleges now allow students to pay their tuition using a credit card. A report includes data from a survey of 100 public 4-year colleges, 100 private 4-year colleges, and 100 community colleges. The accompanying table gives information on credit card acceptance for each of these samples of colleges. Accepts Credit Cards for Tuition Payment Does Not Accept Credit Cards for Tuition Payment Public 4-Year Colleges 90 10 Private 4-Year Colleges 65 35 Community Colleges 100 0 For purposes of...
A paper described a survey of 497 undergraduate students at a state university in the southwestern...
 A paper described a survey of 497 undergraduate students at a state university in the southwestern region of the United States. Each student in the sample was classified according to class standing (freshman, sophomore, junior, or senior) and body art category (body piercings only, tattoos only both tattoos and body piercings, no body art). Use the data in the accompanying table to determine if there is evidence that there is an association between class standing and response to the body...
An article discusses the different roles taken by lionesses as they attack and capture prey. The...
 An article discusses the different roles taken by lionesses as they attack and capture prey. The authors were interested in the effect of the position in line as stalking ours. An individual oness may 24 t h line or on the wing (end of the line) as they advance toward their prey. In addition to position, the role of the lioness was also considered. Alloness could initiate a chase (be the first one to charge the prey), or she could...
An online undergraduate business school uses a learning management software system (LMS) that allows instructors to...
 An online undergraduate business school uses a learning management software system (LMS) that allows instructors to know how many hours students are connected to the course website. When studying for the midterm exam, students have a choice of using two study guides. One study guide comes with the textbook and is professionally prepared by the publisher. The second study guide is prepared by the professor. Suppose the department chairperson is interested in determining whether a student's hours connected to the...
The Wall Street Journal Corporate Perceptions Study 2011 surveyed readers and asked how each rated the...
The Wall Street Journal Corporate Perceptions Study 2011 surveyed readers and asked how each rated the quality of management and the reputation of the company for over 250 worldwide corporations. Both the quality of management and the reputation of the company were rated on an excellent, good, and fair categorical scale. Assume the sample data for 200 respondents below applies to this study. Quality of Management Reputation of Company Excellent Good Fair Excellent 40 25 5 Good 35 28 10...
 A paper described a survey of 497 undergraduate students at a state university in the southwestern region of the United States. Each student in the sample was classified according to class standing (freshman, sophomore, junior, or senior) and body art category (body piercings only, tattoos only both tattoos and body piercings, no body art). Use the data in the accompanying table to determine if there is evidence that there is an association between class standing and response to the body...
 An article discusses the different roles taken by lionesses as they attack and capture prey. The authors were interested in the effect of the position in line as stalking ours. An individual oness may 24 t h line or on the wing (end of the line) as they advance toward their prey. In addition to position, the role of the lioness was also considered. Alloness could initiate a chase (be the first one to charge the prey), or she could...
 An online undergraduate business school uses a learning management software system (LMS) that allows instructors to know how many hours students are connected to the course website. When studying for the midterm exam, students have a choice of using two study guides. One study guide comes with the textbook and is professionally prepared by the publisher. The second study guide is prepared by the professor. Suppose the department chairperson is interested in determining whether a student's hours connected to the...
Most questions answered within 3 hours.
-
The value of the equilibrium constant Kc for the reaction
N2(g)+3H2(g)⇌2NH3(g) changes in the following manner...
asked 4 minutes ago -
There are two flasks on the bench top, one flask contains a 0.50
M NaCl solution...
asked 9 minutes ago -
Which of the following aqueous solutions are good buffer
systems?
.
0.10 M hydrofluoric acid +...
asked 10 minutes ago -
2. An S election is terminated if the S corporation has passive
investment income in excess...
asked 13 minutes ago -
Part of an ANOVA table is shown below.
Source of
Variation
Sum of
Squares
Degrees of...
asked 29 minutes ago -
Business process improvement initiatives often include
introducing new technology to support the new or changed ways...
asked 35 minutes ago -
Review your choice of either Agile or the Waterfall models and
for each of the 22...
asked 37 minutes ago -
Suppose an x distribution has mean μ = 4.
Consider two corresponding
x
distributions, the first...
asked 38 minutes ago -
A study of the effects of exercise used rats bred to have high
or low capacity...
asked 1 hour ago -
Using your data from the experiment, calculate the initial moles
of HCl that you started with....
asked 1 hour ago -
Suppose you want to make 500 mL of a 0.20 M Tris buffer at pH
8.0....
asked 1 hour ago -
The titanic hit an iceberg estimated to be half of her mass.
Before hitting the iceberg,...
asked 1 hour ago