Smith and Johnson Industries has decided to use a p-Chart with 3-sigma control limits to monitor...
Smith and Johnson Industries has decided to use a p-Chart with 3-sigma control limits to monitor the proportion of defective galvanized pipes produced by their production process. The quality control manager randomly samples 150 galvanized pipes at 16 successively selected time periods and counts the number of defective galvanized pipes in the sample.
Step 1 of 8: What is the Center Line of the control chart? Round your answer to three decimal places.
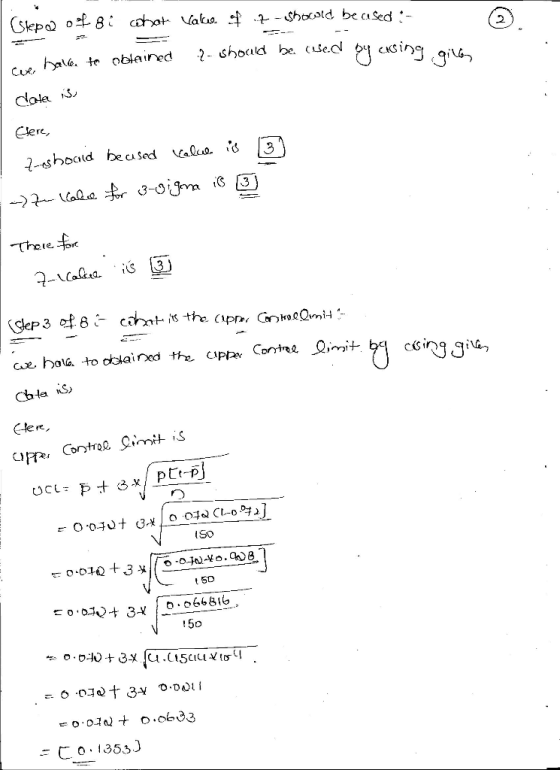
Step 2 of 8: What value of z should be used to construct the control chart?
Step 3 of 8: What is the Upper Control Limit? Round your answer to three decimal places
Step 4 of 8: What is the Lower Control Limit? Round your answer to three decimal places.
Step 5 of 8: At the next time period, 150 galvanized pipes are sampled and 7 defective galvanized pipes are detected.
Step 6 of 8: At the next time period, 150 galvanized pipes are sampled and 18 defective galvanized pipes are detected.
Step 7 of 8: At the next time period, 150 galvanized pipes are sampled and 29 defective galvanized pipes are detected.
Step 8 of 8: You, acting as the quality control manager, have concluded that the process is "Out of Control". What is the probability that the process is really "In Control" and you have made a Type I Error? Round your answer to three decimal places.
defects, 11,12,9,14,7,14,9,7,12,8,10,9,10,12,14,14
Homework Answers


 Due to insufficient time , i
will not answer(8) bit .
Due to insufficient time , i
will not answer(8) bit .
please send the separate question , i will answer it .
Thank you!
Add Answer to:
Smith and Johnson Industries has decided to use a p-Chart with
3-sigma control limits to monitor...
Judy Holmes Industries has decided to use a p-Chart to monitor the proportion of defective castings produced by their production process. The control limits on these charts will be designed to include...
Judy Holmes Industries has decided to use a p-Chart to monitor the proportion of defective castings produced by their production process. The control limits on these charts will be designed to include 95%95% of the sample proportions when the process is In Control. The operations manager randomly samples 400400 castings at 1616 successively selected time periods and counts the number of defective castings in the sample. Table Control Chart Copy Table Step 8 of 8 : You, acting as the...
The J H group's assembly unit has decided to use a p-Chart to monitor the proportion...
The J H group's assembly unit has decided to use a p-Chart to monitor the proportion of defective castings produced by their production process. The control limits on these charts will be designed to include 97% of the sample proportions when the process is In Control. The quality control manager randomly samples 200 castings at 10 successively selected time periods and counts the number of defective castings in the sample. Sample Defects 1...............7 2...............12 3...............8 4...............14 5...............8 6...............9 7...............8 8...............8...
Upper Control Limit pchart
William Industries has decided to use a p-chart with 3-sigma control limits to monitor the proportion of defective galvanized pipes produced by their production process. The operations manager randomly samples 250 galvanized pipes at 10 successivley selected time periods and counts the number of defective galvanized pipes in the sample. What is the Upper Control Limit?
Refer to Table 56.1 - Factors for Computing Control Chart Limits (3 sigma) for this problem....
 Refer to Table 56.1 - Factors for Computing Control Chart Limits (3 sigma) for this problem. Thirty-five samples of size 7 each were taken from a fertilizer-bag-filling machine at Panos Kouvelis Lifelong Lawn Ltd. The results were: Overall mean = 60.75 lb.: Average range R = 1.78 lb. a) For the given sample size, the controllimits for 3-sigma x chart are: Upper Control Limit (UCL)- b. (round your response to three decimal places). Lower Control Limit (LCL:) - (round your...
Refer to Table 56.1 - Factors for Computing Control Chart Limits (3 sigma) for this problem....
 Refer to Table 56.1 - Factors for Computing Control Chart Limits (3 sigma) for this problem. Thirty-five samples of size 7 each were taken from a fertilizer-bag-filing machine at Panos Kouvelis Lifelong Lawn Ltd. The results were: Overall mean = 54.75 16.; Average range R = 1.84 6. a) For the given sample size, the control limits for 3-sigma x chart are: Upper Control Limit (UCL) - b. (round your response to three decimal places). Lower Control Limit (LL)-11. round...
Refer to Table 56.1 - Factors for Computing Control Chart Limits (sigma) for this problem. Thirty-five...
 Refer to Table 56.1 - Factors for Computing Control Chart Limits (sigma) for this problem. Thirty-five samples of size 7 each were taken from a fertilizer-bag-filling machine at Panos Kouvels Lifelong Lawn Lid. The results were: Overal mean = 54.75 lb.: Average range R 164 b. a) For the given sample size, the control limits for 3-sigma x chart are Upper Control Limit (UCL) - D. (round your response to three decimal places). Lower Control Limit (LCL)-1. (round your response...
step 2-what is the upper control limit? round to three decimal places step 3- what is the lower control limit? round to three decimal places step 4- use the following sample data, taken from the...
 step 2-what is the upper control limit? round to three decimal
places
step 3- what is the lower control limit? round to three
decimal places
step 4- use the following sample data, taken from the next
time period, to deteemine if the process “in control” or “out of
control”
observations:12.99,12.98,13.04,13.04,12.98
sample mean: 13.006
step 5:use the following sample data, taken from the next time
period, to deteemine if the process “in control” or “out of
control”
observations: 13,12.98,12.97,12.95,13.04
sample mean:...
step 2-what is the upper control limit? round to three decimal
places
step 3- what is the lower control limit? round to three
decimal places
step 4- use the following sample data, taken from the next
time period, to deteemine if the process “in control” or “out of
control”
observations:12.99,12.98,13.04,13.04,12.98
sample mean: 13.006
step 5:use the following sample data, taken from the next time
period, to deteemine if the process “in control” or “out of
control”
observations: 13,12.98,12.97,12.95,13.04
sample mean:...
Problems 3-5 (1pt each) a toy factory and need a 3-sigma X control chart to monitor the amount of...
 Problems 3-5 (1pt each) a toy factory and need a 3-sigma X control chart to monitor the amount of red dye irn dye follows a normal distribution. When the -6.3. They their red paint used on their fire trucks. The amount of red process is in control, the mean and standard deviation amount of red dye are μ have the following data: 36 and σ Sample Mean Sample Dye Measurements 32, 38, 35 34, 39, 31 Time Period 25,24,19 3....
Refer to the table Factors for Computing Control Chart Limits (3 sigma) for this problem. Pet...
 Refer to the table Factors for Computing Control Chart Limits (3 sigma) for this problem. Pet Products, Inc., caters to the growing market for cat supplies, with a full line of products ranging from litter to toys to flea powder. One of its newer products, a tube of fluid that prevents hairballs in long-haired cats, is produced by an automated machine set to fill each tube with 63 5 grams of paste To keep this filling process under control, four...
that was the complete data the second picture is the control limits Refer to Table S61...
 that was the complete data the second picture is the control
limits
Refer to Table S61 - Factors for Computing Control Chart Limits (3 sigma) for this problem. Ross Hopkins is attempting to monitor a filling process that has an overall average of 705 mL. The average range R is 8 ml. For a sample size of 10, the control limits for 3-sigma x chart are: Upper Control Limit (UCL.2)= ml (round your response to three decimal places). Lower Control...
that was the complete data the second picture is the control
limits
Refer to Table S61 - Factors for Computing Control Chart Limits (3 sigma) for this problem. Ross Hopkins is attempting to monitor a filling process that has an overall average of 705 mL. The average range R is 8 ml. For a sample size of 10, the control limits for 3-sigma x chart are: Upper Control Limit (UCL.2)= ml (round your response to three decimal places). Lower Control...
 Refer to Table 56.1 - Factors for Computing Control Chart Limits (3 sigma) for this problem. Thirty-five samples of size 7 each were taken from a fertilizer-bag-filling machine at Panos Kouvelis Lifelong Lawn Ltd. The results were: Overall mean = 60.75 lb.: Average range R = 1.78 lb. a) For the given sample size, the controllimits for 3-sigma x chart are: Upper Control Limit (UCL)- b. (round your response to three decimal places). Lower Control Limit (LCL:) - (round your...
 Refer to Table 56.1 - Factors for Computing Control Chart Limits (3 sigma) for this problem. Thirty-five samples of size 7 each were taken from a fertilizer-bag-filing machine at Panos Kouvelis Lifelong Lawn Ltd. The results were: Overall mean = 54.75 16.; Average range R = 1.84 6. a) For the given sample size, the control limits for 3-sigma x chart are: Upper Control Limit (UCL) - b. (round your response to three decimal places). Lower Control Limit (LL)-11. round...
 Refer to Table 56.1 - Factors for Computing Control Chart Limits (sigma) for this problem. Thirty-five samples of size 7 each were taken from a fertilizer-bag-filling machine at Panos Kouvels Lifelong Lawn Lid. The results were: Overal mean = 54.75 lb.: Average range R 164 b. a) For the given sample size, the control limits for 3-sigma x chart are Upper Control Limit (UCL) - D. (round your response to three decimal places). Lower Control Limit (LCL)-1. (round your response...
 step 2-what is the upper control limit? round to three decimal
places
step 3- what is the lower control limit? round to three
decimal places
step 4- use the following sample data, taken from the next
time period, to deteemine if the process “in control” or “out of
control”
observations:12.99,12.98,13.04,13.04,12.98
sample mean: 13.006
step 5:use the following sample data, taken from the next time
period, to deteemine if the process “in control” or “out of
control”
observations: 13,12.98,12.97,12.95,13.04
sample mean:...
step 2-what is the upper control limit? round to three decimal
places
step 3- what is the lower control limit? round to three
decimal places
step 4- use the following sample data, taken from the next
time period, to deteemine if the process “in control” or “out of
control”
observations:12.99,12.98,13.04,13.04,12.98
sample mean: 13.006
step 5:use the following sample data, taken from the next time
period, to deteemine if the process “in control” or “out of
control”
observations: 13,12.98,12.97,12.95,13.04
sample mean:...
 Problems 3-5 (1pt each) a toy factory and need a 3-sigma X control chart to monitor the amount of red dye irn dye follows a normal distribution. When the -6.3. They their red paint used on their fire trucks. The amount of red process is in control, the mean and standard deviation amount of red dye are μ have the following data: 36 and σ Sample Mean Sample Dye Measurements 32, 38, 35 34, 39, 31 Time Period 25,24,19 3....
 Refer to the table Factors for Computing Control Chart Limits (3 sigma) for this problem. Pet Products, Inc., caters to the growing market for cat supplies, with a full line of products ranging from litter to toys to flea powder. One of its newer products, a tube of fluid that prevents hairballs in long-haired cats, is produced by an automated machine set to fill each tube with 63 5 grams of paste To keep this filling process under control, four...
 that was the complete data the second picture is the control
limits
Refer to Table S61 - Factors for Computing Control Chart Limits (3 sigma) for this problem. Ross Hopkins is attempting to monitor a filling process that has an overall average of 705 mL. The average range R is 8 ml. For a sample size of 10, the control limits for 3-sigma x chart are: Upper Control Limit (UCL.2)= ml (round your response to three decimal places). Lower Control...
that was the complete data the second picture is the control
limits
Refer to Table S61 - Factors for Computing Control Chart Limits (3 sigma) for this problem. Ross Hopkins is attempting to monitor a filling process that has an overall average of 705 mL. The average range R is 8 ml. For a sample size of 10, the control limits for 3-sigma x chart are: Upper Control Limit (UCL.2)= ml (round your response to three decimal places). Lower Control...
Most questions answered within 3 hours.
-
Magnesium and nitrogen react in a combination reaction to
produce magnesium nitride. 3 Mg + N2...
asked 6 minutes ago -
Two electrons are initially at rest separated by a distance of
2nm. At time t=0, they...
asked 4 minutes ago -
A martial artist is practicing breaking 5 boards. He is able to
break aboard with probability...
asked 11 minutes ago -
The rate constant of a first-order reaction is 2.95 × 10⁻⁴ s−1
at 350.° C. If...
asked 14 minutes ago -
implement a class called PiggyBank that will be used to
represent a collection of coins. Functionality...
asked 6 minutes ago -
2. Use the following information in the table to answer the
following questions. (Numbers are in...
asked 11 minutes ago -
The fuel economy of a 2011 Lexus RX 350 2wd 6 cylinder 3.5 L
automatic 5...
asked 20 minutes ago -
i.
the synthesized compund 2-bromo-butanal i have a IR peak at about
3200 and one at...
asked 20 minutes ago -
A
752 mL sample of water was placed in a 1000 gram pan of aluminum.
The...
asked 31 minutes ago -
1.In the context of chelation, what does binding strength mean?
What happens at the molecular level...
asked 24 minutes ago -
Describe two obstacles that makes fixing atmospheric nitrogen
difficult.
asked 43 minutes ago -
Evelyn incorporates her sole proprietorship, transferring it to
newly formed Papaya Corporation. The assets transferred have...
asked 29 minutes ago