Using IS-LM, graph and explain the effects of a reduction in government spending of $800 trillion...
Using IS-LM, graph and explain the effects of a reduction in government spending of $800 trillion dollars and a MPC of .75. Make sure to include the Money graph and the Keynesian Cross
Homework Answers
Multiplier = 1 / (1 - MPC) = 1 / (1 - 0.75) = 1/0.25 = 4
Decrease in output ($ trillion) = 800 x 4 = 3200
(I) IS-LM Model
A decrease in government spending shifts the IS curve leftward, which decreases both interest rate and output.
In following graph, IS0 and LM0 are initial IS and LM curves intersecting at point A with initial interest rate r0 and output Y0. Decrease in consumption spending shifts IS0 leftward to IS1 (where horizontal distance between IS1 and IS0 is $800 trillion), intersecting LM0 at point B with lower interest rate r1 and lower output Y1 (where Y0 - Y1 = $3200 trillion).

(II) Keynesian Cross
When government spending decreases, the government spending function shifts downward and aggregate expenditure (AE) line shifts downward, decreasing equilibrium output.
In following graph, initial equilibrium is at point A where initial planned aggregate expenditure line PAE0 intersects 450 line with equilibrium aggregate expenditure E0 and output Y0. Lower government spending shifts government spending function downward, from G0 to G1 (where G0 - G1 = $800 trillion), which shifts the PAE line downward to PAE1, intersecting 45 line at point B and decreasing equilibrium output to Y1 (where Y0 - Y1 = $3200 trillion) and decreasing aggregate expenditure to E1 (where E0 - E1 = $3200 trillion).

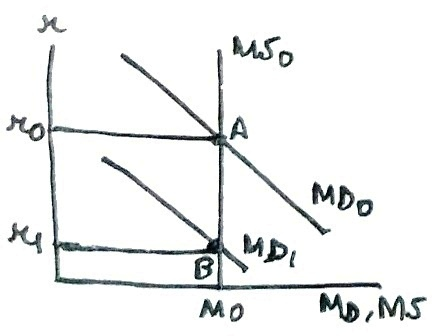
(III) MD-MS
Decrease in government spending causing output to fall will decrease money demand. This shifts money demand curve leftward, reducing interest rate.
In following graph, MD0 and MS0 are initial money demand and supply curves intersecting at point A with initial interest rate r0 and quantity of money Q0. As money demand falls, MD0 shifts left to MD1, intersecting MS0 at point B with lower interest rate r1.
Add Answer to:
Using IS-LM, graph and explain the effects of a reduction in
government spending of $800 trillion...
Using IS-LM graph and explain what happens if we reduce taxes and increase the money supply....
Using IS-LM graph and explain what happens if we reduce taxes and increase the money supply. Make sure to include the Money graph and Kaynesian Cross
A decrease in government spending reduces output more in the Keynesian Cross model than in the...
A decrease in government spending reduces output more in the Keynesian Cross model than in the IS‐LM model. Explain why this is true.
Compare the effects of an expansionary fiscal policy action—an increase in government spending financed by government...
Compare the effects of an expansionary fiscal policy action—an increase in government spending financed by government bond sales to the public, for example—in the Keynesian and classical models. Include in your answer the effects of this policy shift on the level of real income, employment, the price level, and the rate of interest.
Explain and/or show graphically, how the large increase in government spending would impact equilibrium in the...
Explain and/or show graphically, how the large increase in government spending would impact equilibrium in the IS-LM model. (You would need to clearly show/explain the path not just the result in the IS-LM model.) If drawing the graph(s), be sure to label all graphs, axis and any shifts of any curves.
Starting with a graph of the goods market and progressing using the IS-LM diagram show graphically...
Starting with a graph of the goods market and progressing using the IS-LM diagram show graphically and explain how an increase in government spending affects overall macroeconomic equilibrium.
An increase in government spending drives up or increases the private sector investment ." Explain this phenomenon using IS-LM model and evaluate its impact on AD-AS if any
An increase in government spending drives up or increases theprivate sector investment ." Explain this phenomenon using IS-LM model and evaluate its impact on AD-AS if any
The Current U.S. government spending is $4.746 trillion. That's the federal budget for fiscal year 2020...
The Current U.S. government spending is $4.746 trillion. That's the federal budget for fiscal year 2020 covering October 1, 2019, to September 30, 2020. It's 21% of gross domestic product. That means that Government Spending in the United States has increased under the current U.S. Administration. Additionally, last year the Congress passed a tax reform that, among other effects, cut payroll taxes: i) Can you establish the macroeconomics effects of these policies on consumption, investment, interest rate and savings? Use...
use the IS-LM model to answer this question. Suppose there is a simultaneous increase in government...
use the IS-LM model to answer this question. Suppose there is a simultaneous increase in government spending and reduction in money supply. Explain what effect this particular policy mix will have on ouput and interest rate. Base on your analysis, do we know with certainty what effect this policy mix will have on investment? Explain.
Macroeconomics (consumption, investment and loanable funds) question. The Current U.S. government spending is $4.746 trillion. That's...
Macroeconomics (consumption, investment and loanable funds) question. The Current U.S. government spending is $4.746 trillion. That's the federal budget for fiscal year 2020 covering October 1, 2019, to September 30, 2020. It's 21% of gross domestic product. That means that Government Spending in the United States has increased under the current U.S. Administration. Additionally, last year the Congress passed a tax reform that, among other effects, cut payroll taxes: i) Can you establish the macroeconomics effects of these policies on...
Please box answers! Thank you. 11. Monetary policy and the LM curve Aa Aa The following graph shows the demand and supply of real money balances in a hypothetical economy. Use the black point (X point...
 Please box answers! Thank
you.
11. Monetary policy and the LM curve Aa Aa The following graph shows the demand and supply of real money balances in a hypothetical economy. Use the black point (X point) to indicate the equilibrium in this market. Dashed drop lines will automatically extend to both axes. REAL INTEREST RATE [Percent) 10 Equilibrium Supply New Supply New Equilibrium Demand 3 0 10 20 30 40 50 60 70 80 90 100 REAL MONEY BALANCES Help...
Please box answers! Thank
you.
11. Monetary policy and the LM curve Aa Aa The following graph shows the demand and supply of real money balances in a hypothetical economy. Use the black point (X point) to indicate the equilibrium in this market. Dashed drop lines will automatically extend to both axes. REAL INTEREST RATE [Percent) 10 Equilibrium Supply New Supply New Equilibrium Demand 3 0 10 20 30 40 50 60 70 80 90 100 REAL MONEY BALANCES Help...
Most questions answered within 3 hours.
-
______ activity indicates the presence of an electron transport
chain.
1- gelatinase 2- oxidase 3- caseinase...
asked 36 seconds ago -
The molarity of a silver nitrate solution is 0.192 M. How many
grams of silver ions...
asked 13 minutes ago -
Which of the following solutes will produce a greater increase
in boiling point when it is...
asked 9 minutes ago -
true or false: Series connected electrical circuit is a voltage
divider, and voltage of each device...
asked 4 minutes ago -
A 100-W lightbulb has a resistance of about 12 Ω when cold (20
∘C) and 128...
asked 8 minutes ago -
For the asset shown in the following table, use the capital
asset pricing model to find...
asked 9 minutes ago -
If the impulse response of a circuit is a pulse y(t) = u(t) –
u(t-T), T...
asked 16 minutes ago -
Eukaryotic cells have __ which is similar to prokaryotes of
Archaea.
A Ester-linked membrane lipids
B...
asked 25 minutes ago -
true or false. If work is done on a system by it's
surroundings, its value is...
asked 29 minutes ago -
Rene Descartes establishes a dualist approach to the world.
Explain this dualism, and how it connects...
asked 36 minutes ago -
According to a recent national Gallup Poll of U.S. smartphone
user, 35% upgrade their cell phone...
asked 39 minutes ago -
Suppose researchers perform a large-sample test of a population
proportion where the null hypothesis is that...
asked 38 minutes ago