Create a line chart for the closing prices for all years, and a stock chart for...
Create a line chart for the closing prices for all years, and a stock chart for the high/low/close prices for August 2013 in the Excel file S&P 500. (Show all steps in excel)
Homework Answers
The data for all years is downloaded from yahoo finance. The data is available from 1950. Frequency selected is monthly data. This data is filtered using the "Filter" button in "Data" tab. Now, the date column is filtered for dates in December. This gives us the closing price in December for each year from 1950 to 2018

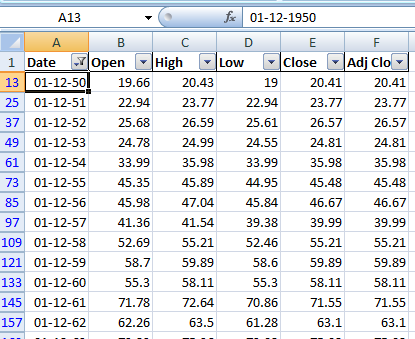
Now, the open, high,low, and close columns are hidden. Only date and adjusted close remaining. Now, go to "Insert" tab in Excel, click the "Line" button, and select "Line". The line chart is displayed

Stock chart :
First, the data for August 2013 is downloaded from yahoo finance

All the columns are hidden except High, Low and Close. Go to "Insert" tab in Excel, click on "other charts" --> "stock charts" --> high-low-close. Then right click on the chart, select data and in the horizontal axis label field, select the dates

Add Answer to:
Create a line chart for the closing prices for all years, and a
stock chart for...
Create a Gantt Chart with EXCEL and show all steps. Activity Preceding Activity Duration (Weeks) C,D...
 Create a Gantt Chart with EXCEL and show all steps.
Activity Preceding Activity Duration (Weeks) C,D E,F C,D G,J,K
Create a Gantt Chart with EXCEL and show all steps.
Activity Preceding Activity Duration (Weeks) C,D E,F C,D G,J,K
1. The Excel file Closing Stock Prices provides data for IBM stock over a 1-month period....
1. The Excel file Closing Stock Prices provides data for IBM stock over a 1-month period. a. Develop spreadsheet models for forecasting IBN stock prices using 2-period moving average and exponential smoothing with a smoothing constant of 0.3. b. Compare your results to the outputs from Excel's Data Analysis tools. c. Using MAD, MSE, MAPE as guidance, which forecasting approach is better in this case? Note: you need show both spreadsheet results and Excel's Data Analysis tool results. show formulas...
2 Select the range A4:G9 and create a clustered column chart Position the clustered column chart...
 2 Select the range A4:G9 and create a clustered column chart Position the clustered column chart so that the upper-left cormer is within cell A15 and the lower-right corner is within cell G34 4 Swap the data on the category axis and in the legend 5 Apply the Style 6 chart style. Select Color 12 in the Change Colors gallery Note, the color name may be listed as Monochromatic Palette 8, depending on the version of Office being used 6...
Which of the following is correct? Typically, stock prices rise from Friday's close to Monday's open,...
 Which of the following is correct? Typically, stock prices rise from Friday's close to Monday's open, according to the weekend effect. O Market reactions to quarterly earnings announcements are immediate. Stock prices fully anticipate information contained in earnings announcements prior to the actual announcement. High P/E stocks tend to underperform low P/E stocks, even after adjusting for risk.
the above screenshot from Google Finance shows the basic stock information for Logitech International SA (USA)...
 the above screenshot from Google Finance shows the basic stock
information for Logitech International SA (USA) after the close of
business on Aug. 22, 2008. What is the difference between the
opening and closing price of the stock on this date?
Use the figure for the question(s) below Logitech International SA (USA) (Public, NASDAQ LOGI)-Add to Portfolio 26.30 26.33 52Wk High: Dividend: Mkt Cap: 466B P/E: 20 83 Ореn: High: 26.06 37 23 FP/E: Yield: 0.18 (069 % ) Low:...
the above screenshot from Google Finance shows the basic stock
information for Logitech International SA (USA) after the close of
business on Aug. 22, 2008. What is the difference between the
opening and closing price of the stock on this date?
Use the figure for the question(s) below Logitech International SA (USA) (Public, NASDAQ LOGI)-Add to Portfolio 26.30 26.33 52Wk High: Dividend: Mkt Cap: 466B P/E: 20 83 Ореn: High: 26.06 37 23 FP/E: Yield: 0.18 (069 % ) Low:...
A financial analysts collects the December 31, 2018 closing stock price for all companies listed in...
A financial analysts collects the December 31, 2018 closing stock price for all companies listed in the S&P 500 index. What kind of data is this? Cross Section Time Series
Please show in excel with formulas 1. Suppose that at the end of December 2008 you...
 Please show in excel with formulas
1. Suppose that at the end of December 2008 you purchased Inc. (Nasdaq: AAPL). It is now five years later and you decide tApple, your holdings to see if you have done well with this inv below shows the end-of-year market prices of AAP table AAPL Stock Prices Date 2008 2009 203.76 2010 311.89 2011 391.60 2012 519.13 2013 561.02 Price 82.53 Enter the data, as shown, into a worksheet and format the table...
Please show in excel with formulas
1. Suppose that at the end of December 2008 you purchased Inc. (Nasdaq: AAPL). It is now five years later and you decide tApple, your holdings to see if you have done well with this inv below shows the end-of-year market prices of AAP table AAPL Stock Prices Date 2008 2009 203.76 2010 311.89 2011 391.60 2012 519.13 2013 561.02 Price 82.53 Enter the data, as shown, into a worksheet and format the table...
The table below shows the closing monthly stock prices for IBM and Amazon. Calculate the simple...
The table below shows the closing monthly stock prices for IBM and Amazon. Calculate the simple three-month moving average for each month for both companies. (Input all amounts as positive values. Do not round intermediate calculations. Round your answers to 2 decimal places.) IBM AMZN January $ 180.44 $ 626.46 February 180.49 632.84 March 202.81 561.38 April 219.75 551.30 May 188.05 491.58 June 212.77 484.78 July 246.46 609.09 August 193.09 532.86 September 224.87 510.36 October 215.67 610.82 November 200.39 583.73...
Visit the NASDAQ historical prices weblink. First, set the date range to be for exactly 1...
 Visit the NASDAQ historical prices weblink. First, set the date
range to be for exactly 1 year ending on the Monday that this
course started. Use March 18, 2018 – March 19, 2019. Do this by
clicking on the blue dates after “Time Period”. Next, click the
“Apply” button. Next, click the link on the right side of the page
that says “Download Data” to save the file to your computer.
This project will only use the Close values. Assume...
Visit the NASDAQ historical prices weblink. First, set the date
range to be for exactly 1 year ending on the Monday that this
course started. Use March 18, 2018 – March 19, 2019. Do this by
clicking on the blue dates after “Time Period”. Next, click the
“Apply” button. Next, click the link on the right side of the page
that says “Download Data” to save the file to your computer.
This project will only use the Close values. Assume...
 Create a Gantt Chart with EXCEL and show all steps.
Activity Preceding Activity Duration (Weeks) C,D E,F C,D G,J,K
Create a Gantt Chart with EXCEL and show all steps.
Activity Preceding Activity Duration (Weeks) C,D E,F C,D G,J,K
 2 Select the range A4:G9 and create a clustered column chart Position the clustered column chart so that the upper-left cormer is within cell A15 and the lower-right corner is within cell G34 4 Swap the data on the category axis and in the legend 5 Apply the Style 6 chart style. Select Color 12 in the Change Colors gallery Note, the color name may be listed as Monochromatic Palette 8, depending on the version of Office being used 6...
 Which of the following is correct? Typically, stock prices rise from Friday's close to Monday's open, according to the weekend effect. O Market reactions to quarterly earnings announcements are immediate. Stock prices fully anticipate information contained in earnings announcements prior to the actual announcement. High P/E stocks tend to underperform low P/E stocks, even after adjusting for risk.
 the above screenshot from Google Finance shows the basic stock
information for Logitech International SA (USA) after the close of
business on Aug. 22, 2008. What is the difference between the
opening and closing price of the stock on this date?
Use the figure for the question(s) below Logitech International SA (USA) (Public, NASDAQ LOGI)-Add to Portfolio 26.30 26.33 52Wk High: Dividend: Mkt Cap: 466B P/E: 20 83 Ореn: High: 26.06 37 23 FP/E: Yield: 0.18 (069 % ) Low:...
the above screenshot from Google Finance shows the basic stock
information for Logitech International SA (USA) after the close of
business on Aug. 22, 2008. What is the difference between the
opening and closing price of the stock on this date?
Use the figure for the question(s) below Logitech International SA (USA) (Public, NASDAQ LOGI)-Add to Portfolio 26.30 26.33 52Wk High: Dividend: Mkt Cap: 466B P/E: 20 83 Ореn: High: 26.06 37 23 FP/E: Yield: 0.18 (069 % ) Low:...
 Please show in excel with formulas
1. Suppose that at the end of December 2008 you purchased Inc. (Nasdaq: AAPL). It is now five years later and you decide tApple, your holdings to see if you have done well with this inv below shows the end-of-year market prices of AAP table AAPL Stock Prices Date 2008 2009 203.76 2010 311.89 2011 391.60 2012 519.13 2013 561.02 Price 82.53 Enter the data, as shown, into a worksheet and format the table...
Please show in excel with formulas
1. Suppose that at the end of December 2008 you purchased Inc. (Nasdaq: AAPL). It is now five years later and you decide tApple, your holdings to see if you have done well with this inv below shows the end-of-year market prices of AAP table AAPL Stock Prices Date 2008 2009 203.76 2010 311.89 2011 391.60 2012 519.13 2013 561.02 Price 82.53 Enter the data, as shown, into a worksheet and format the table...
 Visit the NASDAQ historical prices weblink. First, set the date
range to be for exactly 1 year ending on the Monday that this
course started. Use March 18, 2018 – March 19, 2019. Do this by
clicking on the blue dates after “Time Period”. Next, click the
“Apply” button. Next, click the link on the right side of the page
that says “Download Data” to save the file to your computer.
This project will only use the Close values. Assume...
Visit the NASDAQ historical prices weblink. First, set the date
range to be for exactly 1 year ending on the Monday that this
course started. Use March 18, 2018 – March 19, 2019. Do this by
clicking on the blue dates after “Time Period”. Next, click the
“Apply” button. Next, click the link on the right side of the page
that says “Download Data” to save the file to your computer.
This project will only use the Close values. Assume...
Most questions answered within 3 hours.
-
A χ2-curve, looking at the relationship between age and hours
spent working at an office per...
asked 10 minutes ago -
The pH of a sample of water from a river is 5.0. A
sample of effluent from...
asked 55 minutes ago -
At the beginning of the period, the Fabricating Department
budgeted direct labor of $136,500 and equipment...
asked 1 hour ago -
Please answer all
____ 28. Rent control is usually
justified on the grounds that it protects...
asked 1 hour ago -
PARTS A-D HAVE BEEN ANSWERED. WAS TOLD TO REPOST. ONLY ANSWER
PARTS E and F.
A...
asked 1 hour ago -
2) You are given the task of finding a representation for a
circle in a drawing...
asked 2 hours ago -
STUDY QUESTION: Does use of diet drug fen-phen
(fenfluramine-phentermine) cause valvular heart disease?
HINT: Valvular heart...
asked 2 hours ago -
1. An object weighing 40 N rests on a surface. The coefficient
of friction is 0.35....
asked 3 hours ago -
Investor company owns 35% of investee company voting stock and
accounts for the investment under the...
asked 5 hours ago -
The number of major faults on a randomly chosen 1 km stretch of
highway has a...
asked 5 hours ago -
Consider the competitive environment of Starbuck's, Progressive
Insurance, a manufacturing firm with low turnover, or a...
asked 6 hours ago -
3. Gains from trade
Consider two neighbouring island countries called Euphoria and
Contente. They each have...
asked 8 hours ago