Achievement test scores of all high school seniors in a state have mean 60 and variance...
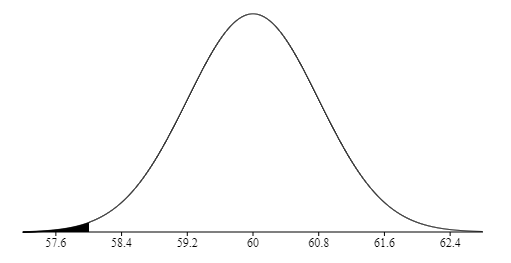
Achievement test scores of all high school seniors in a state have mean 60 and variance 64. A random sample of n = 100 students from one large high school had a mean score of 58. Is there evidence to suggest that this high school is inferior? (Calculate the probability that the sample mean is at most 58 when n = 100.) Show the appropriate graph of the sample mean.
Homework Answers
Here, μ = 60, σ = sqrt(64/100) = 0.8 and x = 58. We need to compute P(X <= 58). The corresponding z-value is calculated using Central Limit Theorem
z = (x - μ)/σ
z = (58 - 60)/0.8 = -2.5
Therefore,
P(X <= 58) = P(z <= (58 - 60)/0.8)
= P(z <= -2.5)
= 0.0062
Add Answer to:
Achievement test scores of all high school seniors in a state
have mean 60 and variance...
Show all work or show syntax for calculator! Please keep three decimal places for all problems...
 Show all work or show syntax for calculator!
Please keep three decimal places for all problems and provide SYNTAX if you do the problems by calculator 1. Achievement test scores of all high school seniors in a state have mean 60 and variance 64. A random sample of n= 100 students from one large high school had a mean score of 58. Is there evidence to suggest that this high school is inferior? (Calculate the probability that the sample mean...
Show all work or show syntax for calculator!
Please keep three decimal places for all problems and provide SYNTAX if you do the problems by calculator 1. Achievement test scores of all high school seniors in a state have mean 60 and variance 64. A random sample of n= 100 students from one large high school had a mean score of 58. Is there evidence to suggest that this high school is inferior? (Calculate the probability that the sample mean...
An achievement test given to high school seniors is used to predict college GPA. The following...
 An achievement test given to high school seniors is used to predict college GPA. The following relationship between the test scores and college GPA exists within the entire population of students: 1. Y 0.10+3.94 X+ E In the above, Y (response) is the college GPA of a given student, X is the student's score on the achievement test (predictor, scored as proportion correct, between 0 and 1), and e is random error, with E~N(0,.005), where the value.005 is the variance...
4. You want to estimate the mean SATM score for 250,000 high school seniors in California. Only a...
 4. You want to estimate the mean SATM score for 250,000 high school seniors in California. Only about 45% of California students take the SAT. These self-selected students are planning to attend college and are not representative of all California seniors A simple random sample (SRS) of 500 California high school seniors is tested. The mean score of the sample is Y 461. What could you say about the mean score, n-508 in the population of all 250,000 seniors? Assume...
1. Suppose the scores for high school seniors on the verbal portion of the SAT test...
1. Suppose the scores for high school seniors on the verbal portion of the SAT test have a population mean of 509 and a population standard deviation of 112. a. List the population and the variable. b. What do you know about the population distribution of SAT scores for high school seniors? (i.e. shape, center, spread) c. Suppose we randomly select 56 high school seniors from this population. What would you expect the shape, mean and standard deviation of the...
You want to estimate the mean SATM score for 250,000 high school seniors in California. Only abou...
 You want to estimate the mean SATM score for 250,000 high school seniors in California. Only about 45% of California students take the SAT. These self-selected students are planning to attend college and are not representative of all California seniors. A simple random sample (SRS) of 500 California high school seniors is tested. The mean score of the sample is Y = 461 What could you say about the mean score, η = 508 in the population of all 250,000...
High school seniors' SAT scores are normally distributed with μ = 1050 and σ = 100
2.) High school seniors' SAT scores are normally distributed with μ = 1050 and σ = 100. If a student is selected at random, find the probability that her SAT score is: a.) above 1200 b.) below 890 c.) between 1000 and 1100 d.) What SAT score separates the smartest 4% of students? e). If 18 seniors are selected, find the probability that their mean SAT score is above 1150 3.) A survey of 200 college students revealed that 160 of them eat dessert...
The state test scores for 12randomly selected high school seniors are shown on the right. Assume...
The state test scores for 12randomly selected high school seniors are shown on the right. Assume the population is normally distributed. 1426 1227 984 695 723 830 730 744 544 624 1440 950 A-Find the sample mean B-Find sample standard deviation Round to one decimal place as needed.
The state test scores for 12 randomly selected high school seniors are shown on the right....
The state test scores for 12 randomly selected high school seniors are shown on the right. Complete parts (a) through (c) below. Assume the population is normally distributed. 1427 1225 989 700 720 839 729 740 542 620 1442 946 (a) Find the sample mean. x=
In a sample of 13 randomly selected high school seniors, the mean score on a standardized...
 In a sample of 13 randomly selected high school seniors, the mean score on a standardized test was 1199 and the standard deviation was 166.0. Further research suggests that the population mean score on this test for high school seniors is 1017. Does the t-value for the original sample fall between -toos and boos? Assume that the population of test scores for high school seniors is normally distributed The t-value oft- fall between -0.99 and long because (Round to two...
The state test scores for 12 randomly selected high school seniors are shown on 1424 the...
 The state test scores for 12 randomly selected high school seniors are shown on 1424 the right. Complete parts (a) through (C) below. 694 721 Assume the population is normally distributed. 630 1221 727 741 1440 981 831 542 940 (a) Find the sample mean. x = = 907.7 (Round to one decimal place as needed.) (b) Find the sample standard deviation. SE (Round to one decimal place as needed.)
 Show all work or show syntax for calculator!
Please keep three decimal places for all problems and provide SYNTAX if you do the problems by calculator 1. Achievement test scores of all high school seniors in a state have mean 60 and variance 64. A random sample of n= 100 students from one large high school had a mean score of 58. Is there evidence to suggest that this high school is inferior? (Calculate the probability that the sample mean...
Show all work or show syntax for calculator!
Please keep three decimal places for all problems and provide SYNTAX if you do the problems by calculator 1. Achievement test scores of all high school seniors in a state have mean 60 and variance 64. A random sample of n= 100 students from one large high school had a mean score of 58. Is there evidence to suggest that this high school is inferior? (Calculate the probability that the sample mean...
 An achievement test given to high school seniors is used to predict college GPA. The following relationship between the test scores and college GPA exists within the entire population of students: 1. Y 0.10+3.94 X+ E In the above, Y (response) is the college GPA of a given student, X is the student's score on the achievement test (predictor, scored as proportion correct, between 0 and 1), and e is random error, with E~N(0,.005), where the value.005 is the variance...
 4. You want to estimate the mean SATM score for 250,000 high school seniors in California. Only about 45% of California students take the SAT. These self-selected students are planning to attend college and are not representative of all California seniors A simple random sample (SRS) of 500 California high school seniors is tested. The mean score of the sample is Y 461. What could you say about the mean score, n-508 in the population of all 250,000 seniors? Assume...
 You want to estimate the mean SATM score for 250,000 high school seniors in California. Only about 45% of California students take the SAT. These self-selected students are planning to attend college and are not representative of all California seniors. A simple random sample (SRS) of 500 California high school seniors is tested. The mean score of the sample is Y = 461 What could you say about the mean score, η = 508 in the population of all 250,000...
 In a sample of 13 randomly selected high school seniors, the mean score on a standardized test was 1199 and the standard deviation was 166.0. Further research suggests that the population mean score on this test for high school seniors is 1017. Does the t-value for the original sample fall between -toos and boos? Assume that the population of test scores for high school seniors is normally distributed The t-value oft- fall between -0.99 and long because (Round to two...
 The state test scores for 12 randomly selected high school seniors are shown on 1424 the right. Complete parts (a) through (C) below. 694 721 Assume the population is normally distributed. 630 1221 727 741 1440 981 831 542 940 (a) Find the sample mean. x = = 907.7 (Round to one decimal place as needed.) (b) Find the sample standard deviation. SE (Round to one decimal place as needed.)
Most questions answered within 3 hours.
-
The Acme Company manufactures widgets. The distribution of
widget weights is bell-shaped. The widget weights have...
asked 25 seconds from now -
Compare and contrast the growth, development, apex and decline
of the Greek and Roman civilizations. What...
asked 2 minutes ago -
Which of the following is NOT true about the VER?
A.
It always produces a loss...
asked 9 minutes ago -
Instructions: How might each of the following parts of the brain
be active while having a...
asked 10 minutes ago -
In 2020, an employee has annual gross salary of $86,000, annual
taxable income of $43,000 (before...
asked 12 minutes ago -
3. Describe, quantitatively, how you would make
250 mL of a 40 mM HEPES buffer at...
asked 12 minutes ago -
An airplane starts
from rest on the runway. The engines exert a constant force of 78.0...
asked 16 minutes ago -
An investigator initiated a clinic-based cohort study in 1997 to
investigate factors associated with HIV seroconversion...
asked 22 minutes ago -
Summarize the challenges of measuring emigration.
asked 28 minutes ago -
Money reports that the average annual cost of the first
year of owning and caring for...
asked 31 minutes ago -
Economists have stated that the marginal propensity to consume
is at least 90¢ out of every...
asked 31 minutes ago -
Find the consumer and producer surpluses by using the demand and
supply functions, where p is...
asked 39 minutes ago