What is the Lorenz curve? What does the Lorenz curve in Exhibit 2 illustrate?
What is the Lorenz curve? What does the Lorenz curve in Exhibit 2 illustrate?
Homework Answers
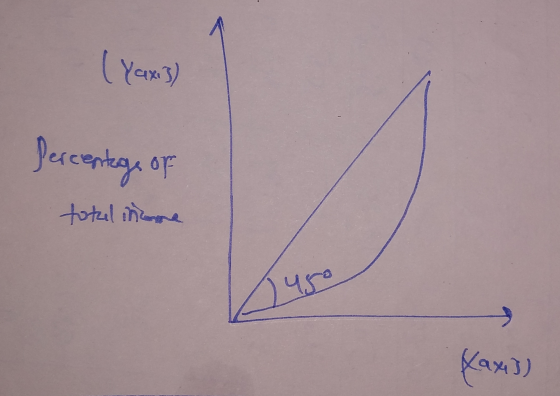
If we talk in simple terms the Lorenz curve shows the distribution of wealth of different people in the country
It is done in a graphical representation
If the line is 45° then there is no inequality in the distribution of wealth in the country
On graph, y-axis represents percentage of total income and x axis representsfraction of total population which is shown below
Add Answer to:
What is the Lorenz curve? What does the Lorenz curve in
Exhibit 2 illustrate?
Using a Lorenz curve/diagram (or curves/diagrams), illustrate a perfectly equal distribution of income, a perfectly...
 Using a Lorenz curve/diagram (or curves/diagrams), illustrate a perfectly equal distribution of income, a perfectly equitable distribution of income, and an economy with no poverty. (2 points) 2.
Using a Lorenz curve/diagram (or curves/diagrams), illustrate a perfectly equal distribution of income, a perfectly equitable distribution of income, and an economy with no poverty. (2 points) 2.
Using a Lorenz curve/diagram (or curves/diagrams), illustrate a perfectly equal distribution of income, a perfectly equitable distribution of income, and an economy with no poverty. (2 points) 2.
1) Figure 2 below is an image of a Lorenz curve. a. (4) When the Lorenz...
 1) Figure 2 below is an image of a Lorenz curve. a. (4) When the Lorenz curve sags lower, does that mean the economy is more equal or more unequal? I i. What does a high number indicate? b. (Explain how to use the information in Figure 2 to calculate the Gini coefficient. i. What is the typical range for Gini coefficients? ii. What does a high number indicate? 100 Perfect Equality Line Percentage of Income Lorenz Curve 0 100...
1) Figure 2 below is an image of a Lorenz curve. a. (4) When the Lorenz...
 1) Figure 2 below is an image of a Lorenz curve. a. (4) When the Lorenz curve sags lower, does that mean the economy is more equal or more unequal? b. (6) Explain how to use the information in Figure 2 to calculate the Gini coefficient 1. What is the typical range for Gini coefficients? ii. What does a high number indicate? 100 Perfect Equality Line Percentage of income Lorenz Curve 100 Percentage of Population Figure 2 2) (10) Describe...
1) Figure 2 below is an image of a Lorenz curve. a. (4) When the Lorenz...
 1) Figure 2 below is an image of a Lorenz curve. a. (4) When the Lorenz curve sags lower, does that mean the economy is more equal or more unequal? b. (6) Explain how to use the information in Figure 2 to calculate the Gini coefficient. i. What is the typical range for Gini coefficients? ii. What does a high number indicate? 100 Perfect Equality Line Percentage of Income Lorenz Curve 100 Percentage of Population Figure 2 2) (10) Describe...
Exhibit 28-1 Refer to Exhibit 28-1. If the Gini coefficient equals 0, then the Lorenz...
Exhibit 28-1 Refer to Exhibit 28-1. If the Gini coefficient equals 0, then the Lorenz curve is
1) Figure 2 below is an image of a Lorenz curve.
 1) Figure 2 below is an image of a Lorenz curve. a. When the Lorenz curve sags lower, does that mean the economy is more equal or more unequal? b. Explain how to use the information in Figure 2 to calculate the Gini coefficient. i. What is the typical range for Gini coefficients? ii. What does a high number indicate? 2) (10) Describe the inequality in income and wealth between countries, and explain whether each has grown or shrank over the past 50 years. Why...
1. WHAT IS THE LORENZ CURVE? IN A COUNTRY WITH A GINI INDEX OF 0 WHAT...
1. WHAT IS THE LORENZ CURVE? IN A COUNTRY WITH A GINI INDEX OF 0 WHAT WOULD THE CURVE LOOK LIKE? 2. DESCRIBE A SOCIAL SAFETY NET FOR THE ELDERLY IN THE UNITED STATES. 3. WHAT ARE THE TWO OBJECTIVES FOR THE ECONOMY?
The greater the area between the Lorenz curve and the diagonal in the Lorenz curve diagram...
The greater the area between the Lorenz curve and the diagonal in the Lorenz curve diagram the: A: smaller is the Gini ratio and the greater is the degree of income inequality B: larger is the Gini ratio and the greater is the degree of income inequality C: smaller is the Gini ratio and the lesser is the degree of income inequality D: larger is the Gini ratio and the lesser is the degree of income inequality
The function of a Lorenz curve is to O A. illustrate the relative effect of inflation on each group of income recipients OB. show the ideal distribution of income in a country. C. plot the relati...
 The function of a Lorenz curve is to O A. illustrate the relative effect of inflation on each group of income recipients OB. show the ideal distribution of income in a country. C. plot the relationship between the cumulative percentage of households receiving income and the cumulative percentage of household income. D. provide a locus of all points for which a given percentage of households receives exactly that cumulative percentage of income.
The function of a Lorenz curve is to...
The function of a Lorenz curve is to O A. illustrate the relative effect of inflation on each group of income recipients OB. show the ideal distribution of income in a country. C. plot the relationship between the cumulative percentage of households receiving income and the cumulative percentage of household income. D. provide a locus of all points for which a given percentage of households receives exactly that cumulative percentage of income.
The function of a Lorenz curve is to...
Lorenz Curve 2) The graph below shows the Lorenz Curve. 60% 50% 10% 0% 20% 30%...
 Lorenz Curve
2) The graph below shows the Lorenz Curve. 60% 50% 10% 0% 20% 30% 50% 60% 70% 100% a) Label both axes right in the graph (type it in the given text boxes). b) Label both curves right in the graph. (type it in the given text boxes) c) Which area in the graph shows the degree of income inequality in this country? You Answer: (2 points) (2 points) can either shade it right in the graph or...
Lorenz Curve
2) The graph below shows the Lorenz Curve. 60% 50% 10% 0% 20% 30% 50% 60% 70% 100% a) Label both axes right in the graph (type it in the given text boxes). b) Label both curves right in the graph. (type it in the given text boxes) c) Which area in the graph shows the degree of income inequality in this country? You Answer: (2 points) (2 points) can either shade it right in the graph or...
 Using a Lorenz curve/diagram (or curves/diagrams), illustrate a perfectly equal distribution of income, a perfectly equitable distribution of income, and an economy with no poverty. (2 points) 2.
Using a Lorenz curve/diagram (or curves/diagrams), illustrate a perfectly equal distribution of income, a perfectly equitable distribution of income, and an economy with no poverty. (2 points) 2.
Using a Lorenz curve/diagram (or curves/diagrams), illustrate a perfectly equal distribution of income, a perfectly equitable distribution of income, and an economy with no poverty. (2 points) 2.
 1) Figure 2 below is an image of a Lorenz curve. a. (4) When the Lorenz curve sags lower, does that mean the economy is more equal or more unequal? I i. What does a high number indicate? b. (Explain how to use the information in Figure 2 to calculate the Gini coefficient. i. What is the typical range for Gini coefficients? ii. What does a high number indicate? 100 Perfect Equality Line Percentage of Income Lorenz Curve 0 100...
 1) Figure 2 below is an image of a Lorenz curve. a. (4) When the Lorenz curve sags lower, does that mean the economy is more equal or more unequal? b. (6) Explain how to use the information in Figure 2 to calculate the Gini coefficient 1. What is the typical range for Gini coefficients? ii. What does a high number indicate? 100 Perfect Equality Line Percentage of income Lorenz Curve 100 Percentage of Population Figure 2 2) (10) Describe...
 1) Figure 2 below is an image of a Lorenz curve. a. (4) When the Lorenz curve sags lower, does that mean the economy is more equal or more unequal? b. (6) Explain how to use the information in Figure 2 to calculate the Gini coefficient. i. What is the typical range for Gini coefficients? ii. What does a high number indicate? 100 Perfect Equality Line Percentage of Income Lorenz Curve 100 Percentage of Population Figure 2 2) (10) Describe...
 The function of a Lorenz curve is to O A. illustrate the relative effect of inflation on each group of income recipients OB. show the ideal distribution of income in a country. C. plot the relationship between the cumulative percentage of households receiving income and the cumulative percentage of household income. D. provide a locus of all points for which a given percentage of households receives exactly that cumulative percentage of income.
The function of a Lorenz curve is to...
The function of a Lorenz curve is to O A. illustrate the relative effect of inflation on each group of income recipients OB. show the ideal distribution of income in a country. C. plot the relationship between the cumulative percentage of households receiving income and the cumulative percentage of household income. D. provide a locus of all points for which a given percentage of households receives exactly that cumulative percentage of income.
The function of a Lorenz curve is to...
 Lorenz Curve
2) The graph below shows the Lorenz Curve. 60% 50% 10% 0% 20% 30% 50% 60% 70% 100% a) Label both axes right in the graph (type it in the given text boxes). b) Label both curves right in the graph. (type it in the given text boxes) c) Which area in the graph shows the degree of income inequality in this country? You Answer: (2 points) (2 points) can either shade it right in the graph or...
Lorenz Curve
2) The graph below shows the Lorenz Curve. 60% 50% 10% 0% 20% 30% 50% 60% 70% 100% a) Label both axes right in the graph (type it in the given text boxes). b) Label both curves right in the graph. (type it in the given text boxes) c) Which area in the graph shows the degree of income inequality in this country? You Answer: (2 points) (2 points) can either shade it right in the graph or...
Most questions answered within 3 hours.
-
Define the 2
24.Moral Imperialism
25.Selective Service Act
26.Tulsa Riot
27.Red Scare
28.League of Nations
29....
asked 6 minutes ago -
A laser beam is incident at an angle of 30.6° to the vertical
onto a solution...
asked 12 minutes ago -
NO VECTORS PLEASE
Start a simple Matrix template class
In this lab, you’ll be writing a...
asked 15 minutes ago -
5. Why might the two alleles, taster and non-taster, persist in
human populations over many generations?...
asked 6 minutes ago -
1- What is the energy of a photon with a frequency of 7.01 ×
10¹⁴ s⁻¹?...
asked 31 minutes ago -
Cesar needs to make a decision whether to fertilize his garden
or not. His profit depends...
asked 34 minutes ago -
Illustrate the Substitution Effect, Income Effect and Total
Effect of a normal good and an inferior...
asked 33 minutes ago -
Your company has six-sigma conformance for each of 10 component
that are a part if a...
asked 46 minutes ago -
Explain the buffering components of urine, the chemical
equation, where the system is found and find...
asked 52 minutes ago -
The financial records of Leon Paul Inc. were destroyed by fire
at the end of 2017....
asked 54 minutes ago -
The normal-curve approximation can also be used for discrete
distribution other than the binomial distribution. For...
asked 1 hour ago -
1. Find the following z values for the standard normal
variable Z. (You may find it...
asked 1 hour ago