Please provide a MATLAB code including instruction on how it works for Target Recognition. Thanks for...
Homework Answers
Target detection refers to the use of high spectral resolution remotely sensed images to map the locations of a target or feature (often a plant species of interest) with a particular spectral or spatial signature. Target detection or feature extraction encompasses a broad range of techniques, including measurements derived from individual bands and more complex methods designed to recognize discrete features by shape, hyperspectral signature, or texture. Targets of interest are often smaller than the pixel size of the image (subpixel target detection) or are mixed with other nontarget cover types within a pixel, requiring techniques such as spectral mixture analysis to detect the target species. Hyperspectral images are useful in target detection because they contain a large contiguous set of spectral bands, often numbering in the hundreds to thousands, and provide large quantities of high spectral resolution data. Using a hyperspectral image, the spectral properties of the target, such as contrast, variability, similarity and discriminability, can be used to detect targets at the subpixel level.
ABSTRACT
Robust small target detection of low signal-to-noise ratio (SNR) is important in infrared search and track applications for self-defense or attacks. Due to the complex background, current algorithms have some unsolved issues with false alarm rate. In order to reduce the false alarm rate, an infrared small target detection algorithm based on saliency detection and support vector machine was proposed. Firstly, we detect salient regions that may contain targets with phase spectrum Fourier transform (PFT) approach. Then, target recognition was performed in the salient regions. Experimental results show the proposed algorithm has ideal robustness and efficiency for real infrared small target detection applications.
INTRODUCTION
Infrared (IR) small-target detection plays a critical role in large amounts of practical projects such as infrared warning and defense alertness, in which not only accuracy is needed but also robustness is required . Various algorithms have been developed in the past few decades . Conventional small target detection methods such as top-hat filter, max-mean/max-median filter and high-pass filters based on support vector machine (SVM) are widely used to reduce the background clutters. In recent years, a series of simple and fast algorithm based on Fourier transform was proposed, such as spectral residual (SR) , phase spectrum of Fourier transform (PFT) , hyper complex Fourier transform (HFT) . With regards to small target detection, frequency domain method is quite different from other methods. It transforms the airspace information to the frequency domain, defines significant target and tests in the frequency domain. While, spectral residual (SR) approach does not rely on the parameters. It calculates the difference between the original signal and a smooth one in the log amplitude spectrum, and then makes up a saliency map by transforming SR to spatial domain. PFT approach detects small targets from the reconstruction that is calculated only by the phase spectrum of the input signal. It omits the computation of SR in the amplitude spectrum, which saves about 1/3 computational cost.
EXISTING METHOD
To detect the target here we are using the neural network classifier. But some drawbacks consisting in the neural network classification.
DRAWBACKS
- Often abused in cases where simpler solutions like linear regression would be best
- Requires a shift load of training and cases
- Black box that not much can be gleaned from
- Increasing accuracy by a few percent can bump up the scale by several magnitudes
PROPOSED SYSTEM
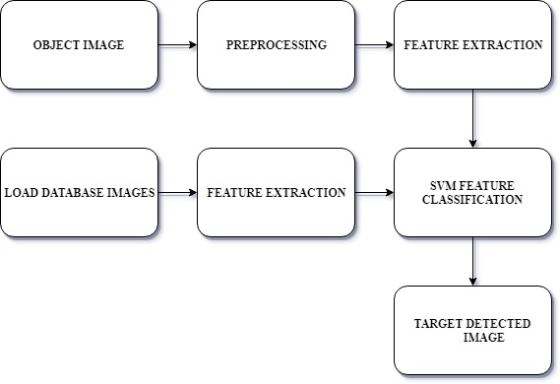
HVS divides the scene into small patches and select important information through visual attention selection mechanism to make it easy to understand and analyze. On the other hand, as a component of low-level artificial vision processing, it facilitates subsequent procedures by reducing computational cost, which is a key consideration in real-time applications. Based on the above knowledge, we propose a framework consisting of two stages inspired by HVS. In pre detection stage, a saliency map (SM) is obtained and the most salient region is picked up to improve detection speed. In detection stage, a support vector machines (SVM) classifier is used to get the target quickly. Due to the two layers structure, the algorithm computational complexity becomes the prime concern. For the simplicity and high processing speed, saliency detection methods in the frequency domain are chosen. For instance, PFT is an advanced and effective method in saliency detection and expounds the real significance of frequency domain significant. Details will be described. Candidate targets can be got through PFT followed by threshold operation.
BLOCK DIAGRAM
ADVANTAGES
- High spectral resolution
- Accurate target detection
SOFTWARE REQUIRMENT
- MATLAB 7.14 and above
APPLICATIONS
- Tracking objects
- Pedestrian detection
Matlab code for Target Detection

CONCLUSION
In this paper, a robust IR small target detection algorithm based on HVS has been proposed. First we propose features of each database image and every input object image. Then SVM classifier separates targets from background clutters. Experimental results show that the proposed algorithm is robust to resist pseudo targets and can achieve a high detection rate in less than 0.02 s with a fast calculation speed. This algorithm can be either directly used in single-frame target detection or used as a foundation module in sequential target tracking for real-time applications.
Add Answer to:
Please provide a MATLAB code including instruction on how it works
for Target Recognition. Thanks for...
please write a MATLAB code for Facial Expression Recognition. Thanks for the help.
please write a MATLAB code for Facial Expression Recognition. Thanks for the help.
Need this answered in Matlab. Show code please. Thanks. The second picture is a pseudo code...
 Need this answered in Matlab. Show code please. Thanks. The
second picture is a pseudo code of how this problem should be
answered. It might help.
QUESTION 5: (Problem 17.13) Bessel functions often arise in advanced engineering analyses such as the study of electric fields. Here are some selected values for the zero-order Bessel function of the first kind. 1.8 2.0 2.2 2.4 2.6 J0.5815 0.5767 0.5560 0.5202 0.4708 Estimate J(2using polyfit and polyval. Also use the MATLAB's built-in function...
Need this answered in Matlab. Show code please. Thanks. The
second picture is a pseudo code of how this problem should be
answered. It might help.
QUESTION 5: (Problem 17.13) Bessel functions often arise in advanced engineering analyses such as the study of electric fields. Here are some selected values for the zero-order Bessel function of the first kind. 1.8 2.0 2.2 2.4 2.6 J0.5815 0.5767 0.5560 0.5202 0.4708 Estimate J(2using polyfit and polyval. Also use the MATLAB's built-in function...
Please provide MATLAB code and comments! Please provide MATLAB code and comments! Please provide MATLAB code...
 Please provide MATLAB code and comments!
 Please provide MATLAB code
and comments!
Question #5. Write a script that creates a variable called BALANCE that is assigned the value 100.00. Then prompt the user to enter an amount to withdraw. Store that amount in a variable called WITHDRAW. Use an if/else construct to display a message to the user stating whether the withdrawal was successful. If the withdrawal would result in a negative balance, state...
Please provide MATLAB code and comments!
Please provide MATLAB code and comments! Please provide MATLAB code
and comments!
Question #5. Write a script that creates a variable called BALANCE that is assigned the value 100.00. Then prompt the user to enter an amount to withdraw. Store that amount in a variable called WITHDRAW. Use an if/else construct to display a message to the user stating whether the withdrawal was successful. If the withdrawal would result in a negative balance, state...
please do this problem in matlab and show me the code. Thanks. please do this problem...
 please do this problem in matlab and show me the code.
Thanks.
please do this problem in matlab and show me the code.
Thanks.
please do this problem in matlab and show me the code.
Thanks.
please do this problem in matlab and show me the code.
Thanks.
please do this problem in matlab and show me the code.
Thanks.please do this problem in matlab
and show me the code. Thanks.
please do this problem in matlab and show me...
please do this problem in matlab and show me the code.
Thanks.
please do this problem in matlab and show me the code.
Thanks.
please do this problem in matlab and show me the code.
Thanks.
please do this problem in matlab and show me the code.
Thanks.
please do this problem in matlab and show me the code.
Thanks.please do this problem in matlab
and show me the code. Thanks.
please do this problem in matlab and show me...
please solve on matlab and provide code thanks, im having a hard tike understanding it. Name:...
 please solve on matlab and provide code thanks, im having a hard
tike understanding it.
Name: ECE 471, In class problem: 2.3 a=125 sec- At = 1msec, In Matlab, plot g(t) t = n At, tel-100 At:100] at u(t) t>O g(t) = -eat u(-t) t<0 Use the FFT to compute g(f), g(f) fft (g)
please solve on matlab and provide code thanks, im having a hard
tike understanding it.
Name: ECE 471, In class problem: 2.3 a=125 sec- At = 1msec, In Matlab, plot g(t) t = n At, tel-100 At:100] at u(t) t>O g(t) = -eat u(-t) t<0 Use the FFT to compute g(f), g(f) fft (g)
PLEASE FOLLOW THE INTRUCTIONS ON THE BOTTOM, includes writing MATLAB code Hello. Please provide solutions to...
 PLEASE FOLLOW THE INTRUCTIONS ON THE BOTTOM,
includes writing MATLAB code
Hello. Please provide solutions to all the parts (a)
& (b)
In your solutions, include as much details as
possible, showing intermediate steps to get to the
answer.
Keep your solutions organized and readable, thank
you =)
Take your time to verify your results.
*** ALSO VERIFY YOUR RESULTS USING MATLAB, AND COPY AND
PASTE THE CODE HERE***
DO NOT use pictures, but rather copy and paste the
code,...
PLEASE FOLLOW THE INTRUCTIONS ON THE BOTTOM,
includes writing MATLAB code
Hello. Please provide solutions to all the parts (a)
& (b)
In your solutions, include as much details as
possible, showing intermediate steps to get to the
answer.
Keep your solutions organized and readable, thank
you =)
Take your time to verify your results.
*** ALSO VERIFY YOUR RESULTS USING MATLAB, AND COPY AND
PASTE THE CODE HERE***
DO NOT use pictures, but rather copy and paste the
code,...
Thanks in advance Provide a MATLAB code to express the position of a moving particle as...
 Thanks in advance
Provide a MATLAB code to express the position of a moving particle as a function of time x = [(t - 15)/100 + 1] sin (3 t) y = [(t - 15)/100 + 1] cos (0.8 t) z = 0.4 t^(3/2)
Thanks in advance
Provide a MATLAB code to express the position of a moving particle as a function of time x = [(t - 15)/100 + 1] sin (3 t) y = [(t - 15)/100 + 1] cos (0.8 t) z = 0.4 t^(3/2)
Please show working as well. Thanks What is the machine code of the instruction "NOT R4,...
 Please show working as well. Thanks
What is the machine code of the instruction "NOT R4, R2"? Select one: a. X127F b. x16C2 c. x5B04 d. x98BF e. X56E
Please show working as well. Thanks
What is the machine code of the instruction "NOT R4, R2"? Select one: a. X127F b. x16C2 c. x5B04 d. x98BF e. X56E
12.22 Draw the Bode plot for the network function, IN MATLAB, please provide MatLab code for...
 12.22 Draw the Bode plot for the network function, IN MATLAB,
please provide MatLab code for the work and screenshots of the Bode
Plot
12.22 Draw the Bode plot for the network function, IN MATLAB,
please provide MatLab code for the work and screenshots of the Bode
Plot
Please provide the Matlab code along with the inference. Also please confirm the answer from matlab...
 Please provide the Matlab code along with the inference. Also
please confirm the answer from matlab code with numerical
analysis.
Determine and plot the response of the system shown in Fig. 4 using MATLAB. The response is xo(t) when the input xi(t) is a unit step displacement input. The parameters of the system are ki = 15 N/m, k2= 25 N/m, ci = 7 N-s/m, c2 = 15 N-s/m. X(t) ye Fig. 4
Please provide the Matlab code along with the inference. Also
please confirm the answer from matlab code with numerical
analysis.
Determine and plot the response of the system shown in Fig. 4 using MATLAB. The response is xo(t) when the input xi(t) is a unit step displacement input. The parameters of the system are ki = 15 N/m, k2= 25 N/m, ci = 7 N-s/m, c2 = 15 N-s/m. X(t) ye Fig. 4
 Need this answered in Matlab. Show code please. Thanks. The
second picture is a pseudo code of how this problem should be
answered. It might help.
QUESTION 5: (Problem 17.13) Bessel functions often arise in advanced engineering analyses such as the study of electric fields. Here are some selected values for the zero-order Bessel function of the first kind. 1.8 2.0 2.2 2.4 2.6 J0.5815 0.5767 0.5560 0.5202 0.4708 Estimate J(2using polyfit and polyval. Also use the MATLAB's built-in function...
Need this answered in Matlab. Show code please. Thanks. The
second picture is a pseudo code of how this problem should be
answered. It might help.
QUESTION 5: (Problem 17.13) Bessel functions often arise in advanced engineering analyses such as the study of electric fields. Here are some selected values for the zero-order Bessel function of the first kind. 1.8 2.0 2.2 2.4 2.6 J0.5815 0.5767 0.5560 0.5202 0.4708 Estimate J(2using polyfit and polyval. Also use the MATLAB's built-in function...
 Please provide MATLAB code and comments!
 Please provide MATLAB code
and comments!
Question #5. Write a script that creates a variable called BALANCE that is assigned the value 100.00. Then prompt the user to enter an amount to withdraw. Store that amount in a variable called WITHDRAW. Use an if/else construct to display a message to the user stating whether the withdrawal was successful. If the withdrawal would result in a negative balance, state...
Please provide MATLAB code and comments!
Please provide MATLAB code and comments! Please provide MATLAB code
and comments!
Question #5. Write a script that creates a variable called BALANCE that is assigned the value 100.00. Then prompt the user to enter an amount to withdraw. Store that amount in a variable called WITHDRAW. Use an if/else construct to display a message to the user stating whether the withdrawal was successful. If the withdrawal would result in a negative balance, state...
 please do this problem in matlab and show me the code.
Thanks.
please do this problem in matlab and show me the code.
Thanks.
please do this problem in matlab and show me the code.
Thanks.
please do this problem in matlab and show me the code.
Thanks.
please do this problem in matlab and show me the code.
Thanks.please do this problem in matlab
and show me the code. Thanks.
please do this problem in matlab and show me...
please do this problem in matlab and show me the code.
Thanks.
please do this problem in matlab and show me the code.
Thanks.
please do this problem in matlab and show me the code.
Thanks.
please do this problem in matlab and show me the code.
Thanks.
please do this problem in matlab and show me the code.
Thanks.please do this problem in matlab
and show me the code. Thanks.
please do this problem in matlab and show me...
 please solve on matlab and provide code thanks, im having a hard
tike understanding it.
Name: ECE 471, In class problem: 2.3 a=125 sec- At = 1msec, In Matlab, plot g(t) t = n At, tel-100 At:100] at u(t) t>O g(t) = -eat u(-t) t<0 Use the FFT to compute g(f), g(f) fft (g)
please solve on matlab and provide code thanks, im having a hard
tike understanding it.
Name: ECE 471, In class problem: 2.3 a=125 sec- At = 1msec, In Matlab, plot g(t) t = n At, tel-100 At:100] at u(t) t>O g(t) = -eat u(-t) t<0 Use the FFT to compute g(f), g(f) fft (g)
 PLEASE FOLLOW THE INTRUCTIONS ON THE BOTTOM,
includes writing MATLAB code
Hello. Please provide solutions to all the parts (a)
& (b)
In your solutions, include as much details as
possible, showing intermediate steps to get to the
answer.
Keep your solutions organized and readable, thank
you =)
Take your time to verify your results.
*** ALSO VERIFY YOUR RESULTS USING MATLAB, AND COPY AND
PASTE THE CODE HERE***
DO NOT use pictures, but rather copy and paste the
code,...
PLEASE FOLLOW THE INTRUCTIONS ON THE BOTTOM,
includes writing MATLAB code
Hello. Please provide solutions to all the parts (a)
& (b)
In your solutions, include as much details as
possible, showing intermediate steps to get to the
answer.
Keep your solutions organized and readable, thank
you =)
Take your time to verify your results.
*** ALSO VERIFY YOUR RESULTS USING MATLAB, AND COPY AND
PASTE THE CODE HERE***
DO NOT use pictures, but rather copy and paste the
code,...
 Thanks in advance
Provide a MATLAB code to express the position of a moving particle as a function of time x = [(t - 15)/100 + 1] sin (3 t) y = [(t - 15)/100 + 1] cos (0.8 t) z = 0.4 t^(3/2)
Thanks in advance
Provide a MATLAB code to express the position of a moving particle as a function of time x = [(t - 15)/100 + 1] sin (3 t) y = [(t - 15)/100 + 1] cos (0.8 t) z = 0.4 t^(3/2)
 Please show working as well. Thanks
What is the machine code of the instruction "NOT R4, R2"? Select one: a. X127F b. x16C2 c. x5B04 d. x98BF e. X56E
Please show working as well. Thanks
What is the machine code of the instruction "NOT R4, R2"? Select one: a. X127F b. x16C2 c. x5B04 d. x98BF e. X56E
 12.22 Draw the Bode plot for the network function, IN MATLAB,
please provide MatLab code for the work and screenshots of the Bode
Plot
12.22 Draw the Bode plot for the network function, IN MATLAB,
please provide MatLab code for the work and screenshots of the Bode
Plot
 Please provide the Matlab code along with the inference. Also
please confirm the answer from matlab code with numerical
analysis.
Determine and plot the response of the system shown in Fig. 4 using MATLAB. The response is xo(t) when the input xi(t) is a unit step displacement input. The parameters of the system are ki = 15 N/m, k2= 25 N/m, ci = 7 N-s/m, c2 = 15 N-s/m. X(t) ye Fig. 4
Please provide the Matlab code along with the inference. Also
please confirm the answer from matlab code with numerical
analysis.
Determine and plot the response of the system shown in Fig. 4 using MATLAB. The response is xo(t) when the input xi(t) is a unit step displacement input. The parameters of the system are ki = 15 N/m, k2= 25 N/m, ci = 7 N-s/m, c2 = 15 N-s/m. X(t) ye Fig. 4
Most questions answered within 3 hours.
-
3. Gains from trade
Consider two neighbouring island countries called Euphoria and
Contente. They each have...
asked 1 hour ago -
A business executive has the option to invest money in two
plans: Plan A guarantees that...
asked 3 hours ago -
Hello, can someone please help me answer this question?
How much heat is absorbed by a...
asked 3 hours ago -
. A marketing researcher conducted a survey of 25 shoppers
randomly selected at the local mall...
asked 4 hours ago -
Create an comprehensive response to the
following:
Antimicrobial agents work on a multitude of microbes (bacteria,...
asked 4 hours ago -
6.13 LAB: Step counter. Section 6.3.
A pedometer treats walking 2,000 steps as walking 1 mile....
asked 4 hours ago -
(14.2) A block of mass m = 10 kg riding on a frictionless
horizontal plane is...
asked 4 hours ago -
Use any search engine to search for articles about Starbucks
partnership with Tata Companies in India...
asked 4 hours ago -
Let’s say that for some reason Bank Excess Reserves suddenly
increase sharply. What effect would this...
asked 4 hours ago -
Given:
Curent Assets: $600,000
Total Assets: $2,600,000
Current Liabilities: $500,000
Total Liabilities: $1,700,000
What is the...
asked 4 hours ago -
1. What is a “Bankster”? What is insider trading? Why is it
illegal?
2. What is...
asked 4 hours ago -
A transverse wave on a cord is given by
D(x,t)=0.18sin(2.7x−61.0t), where Dand x are in m...
asked 4 hours ago