CD4 cells are carried in the blood as part of the human immune system. One of...
CD4 cells are carried in the blood as part of the human immune system. One of the effects of the HIV virus is that these cells die. In this study of the effectiveness of a new anti-viral drug on HIV, 20 HIV-positive patients had their CD4 counts recorded (“Baseline”) and then were put on a course of treatment with this drug. After using the drug for one year, their CD4 counts were again recorded (“OneYear”). The aim was to show that patients taking the drug had increased CD4 counts which is not generally seen in HIV-positive patients.
|
Baseline |
OneYear |
|
2.12 |
2.47 |
|
4.35 |
4.61 |
|
3.39 |
5.26 |
|
2.51 |
3.02 |
|
4.04 |
6.36 |
|
5.1 |
5.93 |
|
3.77 |
3.93 |
|
3.35 |
4.09 |
|
4.1 |
4.88 |
|
3.35 |
3.81 |
|
4.15 |
4.74 |
|
3.56 |
3.29 |
|
3.39 |
5.55 |
|
1.88 |
2.82 |
|
2.56 |
4.23 |
|
2.96 |
3.23 |
|
2.49 |
2.56 |
|
3.03 |
4.31 |
|
2.66 |
4.37 |
|
3.00 |
2.40 |
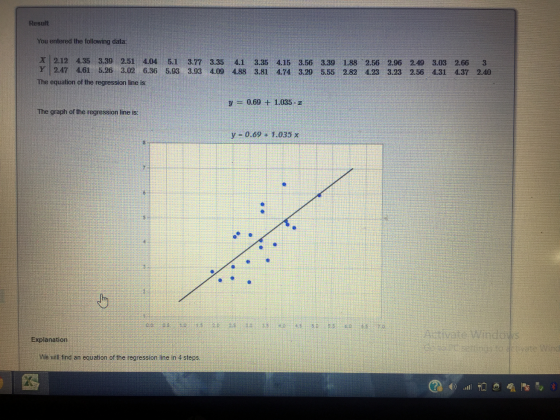
1) What is the correlation between baseline and one year CD4 counts?
2) What does this suggest about the relationship between baseline and one year CD4 counts?
3) What is the least squares equation of the fitted regression line?
OneYear =
4) In terms of the above, what would be the null hypothesis to test the association between the baseline and one year follow-up values?
Homework Answers

 1)
r=0.72 chack in image , with calculations
1)
r=0.72 chack in image , with calculations
2) there is positive correlation between them, but not strong not bad relationships between tham... check in image
draw scatter diagram you can see how they perform....
3) we crest model linear regression. Check in image...with calculations
Add Answer to:
CD4 cells are carried in the blood as part of the human immune
system. One of...
1. Two manufacturing processes are being compared to try to reduce the number of defective products...
 1. Two manufacturing processes are being compared to try to reduce the number of defective products made. During 8 shifts for each process, the following results were observed: Line A Line B n 181 | 187 Based on a 5% significance level, did line B have a larger average than line A? *Use the tables I gave you in the handouts for the critical values *Use the appropriate test statistic value, NOT the p-value method *Use and show the 5...
 1. Two manufacturing processes are being compared to try to reduce the number of defective products made. During 8 shifts for each process, the following results were observed: Line A Line B n 181 | 187 Based on a 5% significance level, did line B have a larger average than line A? *Use the tables I gave you in the handouts for the critical values *Use the appropriate test statistic value, NOT the p-value method *Use and show the 5...
Most questions answered within 3 hours.
-
In python,write a function nameSet(first, last) that takes a
person's first and last names as input,...
asked 51 minutes ago -
How do you think we should value management? Specifically how
might we try to determine MRPL...
asked 43 minutes ago -
Suppose the Central Bank of Turkey starts to pay
interest on reserves. Under what circumstances this...
asked 52 minutes ago -
For Bergson the concept of Being contains less reality than does
the concept of Becoming. True...
asked 2 hours ago -
What is the hydroxide ion concentration, [OH-], in a solution
with a hydronium ion concentration, [H3O+]...
asked 1 hour ago -
What species is the reducing agent in the following
equation?
Mg(s) + 2HCl (aq) --> MgCl2(aq)...
asked 2 hours ago -
A 50g ice cube is taken out of a freezer at 0 degrees Celsius
and put...
asked 3 hours ago -
How do ratios help you determine trends? What specific
information do managers look at? Is there...
asked 3 hours ago -
A wavelength of 514 nm is used to find an unknown diffraction
grating. If the separation...
asked 3 hours ago -
Use the central limit theorem to find the mean and standard
error of the mean of...
asked 4 hours ago -
You will be given a file that will contain averages for classes
which are divided into...
asked 4 hours ago -
A Pew Research Center poll surveyed a random sample 850 voters
and asked them if they...
asked 4 hours ago