
Homework Answers
We will use MINITAB software to answer this question,
1) using 3 period MA the forecast for period 10 is 16.3333 .
2) using 5 period MA the forecast for period 10 is 14.96 .


3) using alpha=0.5 forecast for period 10 is 16.5729
4) using alpha=0.9 forecast for period 10 is 17.9745
as per HomeworkLib policy w have permission to answer first 4 subparts of a question
Add Answer to:
Homework #6 NAME: (State numerical answers #1 Use the leffersonCommunityCollege data set to answe...
#1.8 The MSE-better forecast for the foregoing Moving Average models is #1.9 The MSE-better forec...
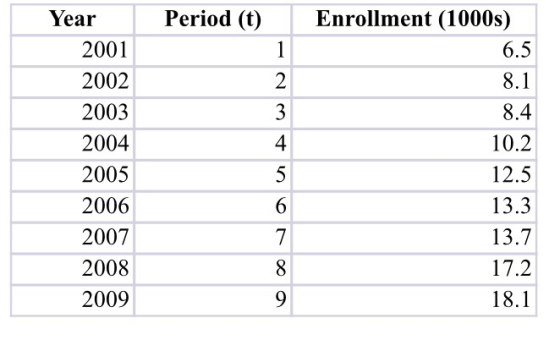
 #1.8 The MSE-better forecast for the foregoing Moving Average models is #1.9 The MSE-better forecast for the foregoing Exponential Smoothing models is #1.10 The MSE-best model among the foregoing Moving Average, Exponential Smoothing, and Linear Regression models is because Year Period (t)Enrollment (1000s) 2001 2002 2003 2004 2005 2006 2007 2008 2009 6.5 8.1 8.4 10.2 12.5 13.3 13.7 17.2 18.1 4
#1.8 The MSE-better forecast for the foregoing Moving Average models is #1.9 The MSE-better forecast for the foregoing...
#1.8 The MSE-better forecast for the foregoing Moving Average models is #1.9 The MSE-better forecast for the foregoing Exponential Smoothing models is #1.10 The MSE-best model among the foregoing Moving Average, Exponential Smoothing, and Linear Regression models is because Year Period (t)Enrollment (1000s) 2001 2002 2003 2004 2005 2006 2007 2008 2009 6.5 8.1 8.4 10.2 12.5 13.3 13.7 17.2 18.1 4
#1.8 The MSE-better forecast for the foregoing Moving Average models is #1.9 The MSE-better forecast for the foregoing...
1.Please use the Hawkins sheet. What is the MFE , MAE , MSE , an...
 1.Please use the Hawkins sheet.
What is the MFE , MAE , MSE ,
and MAPE for a three-month moving average
forecast? Round to two decimal places.
2.Please use the Hawkins sheet.
What is the MFE , MAE , MSE ,
and MAPE for the exponential smoothing forecast with
alpha = 0.2? Round to two decimal places.
3.Please use the Hawkins sheet.
Based on the MSE values found in Questions 1 & 2, which
forecast is best?
------------------------------------------------------------------
Thank you...
1.Please use the Hawkins sheet.
What is the MFE , MAE , MSE ,
and MAPE for a three-month moving average
forecast? Round to two decimal places.
2.Please use the Hawkins sheet.
What is the MFE , MAE , MSE ,
and MAPE for the exponential smoothing forecast with
alpha = 0.2? Round to two decimal places.
3.Please use the Hawkins sheet.
Based on the MSE values found in Questions 1 & 2, which
forecast is best?
------------------------------------------------------------------
Thank you...
Please help Consider the following time series data. Week 1 N 3 4 5 6 Value...
 Please help
Consider the following time series data. Week 1 N 3 4 5 6 Value 19 11 13 10 14 12 (a) Construct a time series plot. 20 18 20 18 14 12 10 Week 3 4 Week D 20 18+ 16 Time Series Value Time Series Value 5 Week 0 Wook What type of pattem exists in the data? The data appear to follow a cyclical pattern. The data appear to follow a trend pattem. The data appear...
Please help
Consider the following time series data. Week 1 N 3 4 5 6 Value 19 11 13 10 14 12 (a) Construct a time series plot. 20 18 20 18 14 12 10 Week 3 4 Week D 20 18+ 16 Time Series Value Time Series Value 5 Week 0 Wook What type of pattem exists in the data? The data appear to follow a cyclical pattern. The data appear to follow a trend pattem. The data appear...
A restaurant wants to forecast its weekly sales. Historical data (in dollars) for 15 weeks are...
 A restaurant wants to forecast its weekly sales. Historical data (in dollars) for 15 weeks are shown below. Observation Time Period 1,620 1,533 1,419 1,234 1,278 1,371 1,563 1,375 1,386 1,594 1,387 1,533 1,648 1,654 1,399 MSE values based on the two- and three-period moving average are 25,543.12 and 24,466.09, respectively. Find the best single exponential smoothing model by evaluating the MSE from 0.1 to 0.9, in increments of 0.1. Do not round intermediate calculations. Round your answers to two...
Consider the following time series data. Week 1 2 3 4 5 6 Value 19 11 16 1017 15 (a) Construct a ...
 Consider the following time series data. Week 1 2 3 4 5 6 Value 19 11 16 1017 15 (a) Construct a time series plot. 20 20 20 18 16 14 12 10 c 14 12 12 0 23 4 5 67 0 23 4 5 67 Week Weck Week 20 18 0 1 2345 6 7 Week What type of pattern exists in the data? The data appear to follow a seasonal pattern. The data appear to follow a...
Ch8-A For data of weekly returns (in %) of Google stock given here, forecast the return for the w...
 Ch8-A For data of weekly returns (in %) of Google stock given here, forecast the return for the week of March 5, 2017 as follows. [Note: Express your forecasts in % rounded to to 2 decimal places (eg, 3.23%), and express the MSE's and MAE rounded to 5 decimal places (e.g., 0.00073).] (a) Use a 3-week moving average and find the MSE and MAE. (b) Use exponential smoothing with alpha value 0.3 and compute the error measures (c) Now using...
Can you please answer this and show the formulas?? Consider the quarterly sales data for Worthington...
Can you please answer this and show the formulas?? Consider the quarterly sales data for Worthington Health Club shown below: Quarter Total Year 1 2 3 4 Sales 1 4 1 3 7 15 2 6 5 2 18 31 3 13 1 7 18 39 4 14 11 6 18 49 5 20 11 13 30 74 Develop a four-period moving average model and compute MSE for your forecasts. Do not round intermediate calculations. Round your answers to two...
Consider the following time series data. Week 1 2 3 4 5 6 Value 19 13 16 12 18 14 a. Whic...
Consider the following time series data. Week 1 2 3 4 5 6 Value 19 13 16 12 18 14 a. Which of the following is a correct time series plot for this data? - Select your answer -plot #1plot #2plot #3Item 1 What type of pattern exists in the data? - Select your answer -VerticalHorizontalScatterItem 2 b. Develop the three-week moving average forecasts for this time series. Compute MSE and a forecast for week (to 2 decimals if necessary)....
Two experienced managers at Wilson Boat Inc. are resisting the introduction of a computerized exponential smoothing...
Two experienced managers at Wilson Boat Inc. are resisting the introduction of a computerized exponential smoothing system, claiming that their judgmental forecasts are much better than any computer could do. Their past record of predictions is as follows: Week Actual Demand Manager's Forecast 1 3,800 4,400 2 4,100 4,800 3 4,300 3,700 4 3,100 3,800 5 3,900 3,500 6 4,500 3,500 7 5,700 4,900 8 4,000 4,700 9 4,500 3,500 10 4,900 5,400 How would the manager’s forecast compare to...
 #1.8 The MSE-better forecast for the foregoing Moving Average models is #1.9 The MSE-better forecast for the foregoing Exponential Smoothing models is #1.10 The MSE-best model among the foregoing Moving Average, Exponential Smoothing, and Linear Regression models is because Year Period (t)Enrollment (1000s) 2001 2002 2003 2004 2005 2006 2007 2008 2009 6.5 8.1 8.4 10.2 12.5 13.3 13.7 17.2 18.1 4
#1.8 The MSE-better forecast for the foregoing Moving Average models is #1.9 The MSE-better forecast for the foregoing...
#1.8 The MSE-better forecast for the foregoing Moving Average models is #1.9 The MSE-better forecast for the foregoing Exponential Smoothing models is #1.10 The MSE-best model among the foregoing Moving Average, Exponential Smoothing, and Linear Regression models is because Year Period (t)Enrollment (1000s) 2001 2002 2003 2004 2005 2006 2007 2008 2009 6.5 8.1 8.4 10.2 12.5 13.3 13.7 17.2 18.1 4
#1.8 The MSE-better forecast for the foregoing Moving Average models is #1.9 The MSE-better forecast for the foregoing...
 1.Please use the Hawkins sheet.
What is the MFE , MAE , MSE ,
and MAPE for a three-month moving average
forecast? Round to two decimal places.
2.Please use the Hawkins sheet.
What is the MFE , MAE , MSE ,
and MAPE for the exponential smoothing forecast with
alpha = 0.2? Round to two decimal places.
3.Please use the Hawkins sheet.
Based on the MSE values found in Questions 1 & 2, which
forecast is best?
------------------------------------------------------------------
Thank you...
1.Please use the Hawkins sheet.
What is the MFE , MAE , MSE ,
and MAPE for a three-month moving average
forecast? Round to two decimal places.
2.Please use the Hawkins sheet.
What is the MFE , MAE , MSE ,
and MAPE for the exponential smoothing forecast with
alpha = 0.2? Round to two decimal places.
3.Please use the Hawkins sheet.
Based on the MSE values found in Questions 1 & 2, which
forecast is best?
------------------------------------------------------------------
Thank you...
 Please help
Consider the following time series data. Week 1 N 3 4 5 6 Value 19 11 13 10 14 12 (a) Construct a time series plot. 20 18 20 18 14 12 10 Week 3 4 Week D 20 18+ 16 Time Series Value Time Series Value 5 Week 0 Wook What type of pattem exists in the data? The data appear to follow a cyclical pattern. The data appear to follow a trend pattem. The data appear...
Please help
Consider the following time series data. Week 1 N 3 4 5 6 Value 19 11 13 10 14 12 (a) Construct a time series plot. 20 18 20 18 14 12 10 Week 3 4 Week D 20 18+ 16 Time Series Value Time Series Value 5 Week 0 Wook What type of pattem exists in the data? The data appear to follow a cyclical pattern. The data appear to follow a trend pattem. The data appear...
 A restaurant wants to forecast its weekly sales. Historical data (in dollars) for 15 weeks are shown below. Observation Time Period 1,620 1,533 1,419 1,234 1,278 1,371 1,563 1,375 1,386 1,594 1,387 1,533 1,648 1,654 1,399 MSE values based on the two- and three-period moving average are 25,543.12 and 24,466.09, respectively. Find the best single exponential smoothing model by evaluating the MSE from 0.1 to 0.9, in increments of 0.1. Do not round intermediate calculations. Round your answers to two...
 Consider the following time series data. Week 1 2 3 4 5 6 Value 19 11 16 1017 15 (a) Construct a time series plot. 20 20 20 18 16 14 12 10 c 14 12 12 0 23 4 5 67 0 23 4 5 67 Week Weck Week 20 18 0 1 2345 6 7 Week What type of pattern exists in the data? The data appear to follow a seasonal pattern. The data appear to follow a...
 Ch8-A For data of weekly returns (in %) of Google stock given here, forecast the return for the week of March 5, 2017 as follows. [Note: Express your forecasts in % rounded to to 2 decimal places (eg, 3.23%), and express the MSE's and MAE rounded to 5 decimal places (e.g., 0.00073).] (a) Use a 3-week moving average and find the MSE and MAE. (b) Use exponential smoothing with alpha value 0.3 and compute the error measures (c) Now using...
Most questions answered within 3 hours.
-
#22 Suppose cars pass an intersection at a rate of 120 per hour.
What is the...
asked 2 minutes ago -
for project management course
An indicator of project success within an organization is the
strength of...
asked 9 minutes ago -
How did immigration affect the culture of the United States?
Explain in detail and give specific...
asked 16 minutes ago -
A dolphin in an aquatic show jumps straight up out of the water
at a velocity...
asked 1 hour ago -
x
P(x)
0
0.25
1
0.2
2
0.15
3
0.4
Find the standard deviation of this...
asked 2 hours ago -
An economist claims that he has found evidence to support the
assumption that the investment expenditure...
asked 3 hours ago -
Question 10 (1 point)
Suppose that a researcher studying the weight of female college
athletes wants...
asked 4 hours ago -
a. Using your
molecular modeling kit, build a model of sucrose. Locate the oxygen
bridge in...
asked 4 hours ago -
Below is a
linear time complexity algorithm Max-Min-VER1 to find the biggest
and smallest element a...
asked 4 hours ago -
A women tries to swim perpendicular across the river to the
opposite bank at 2.0m/s with...
asked 5 hours ago -
The amount of time it takes for a student to complete a
statistics quiz is uniformly...
asked 6 hours ago -
True or False: If some system undergoes a reversible,
isothermal
process, then its entropy must remain...
asked 5 hours ago