

Homework Answers
Forecast and MSE for moving averages are calculated as below:

EXCEL FORMULA:

--------------------------------------------------------------
Exponential smoothing forecast and MSE is calculated as below:
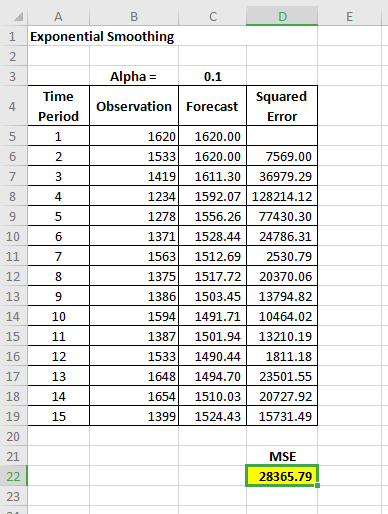
EXCEL FORMULA:

-------------------------------------------------------------------
Change the alpha values in cell C3 and note down MSE for each value of alpha.


------------------------------
| Alpha | MSE |
| 0.1 | 28365.79 |
| 0.2 | 24783.60 |
| 0.3 | 23006.40 |
| 0.4 | 22025.22 |
| 0.5 | 21578.29 |
| 0.6 | 21493.58 |
| 0.7 | 21656.08 |
| 0.8 | 21996.98 |
| 0.9 | 22481.48 |
--------------------------------------
The lowest value of MSE is 21,493.58 pertaining to alpha of 0.6
The model based on a smoothing constant of 0.6 is the best.
The Exponential smoothing model has the lowest MSE value.
Add Answer to:
A restaurant wants to forecast its weekly sales. Historical data (in dollars) for 15 weeks are...
Can you please answer this and show the formulas?? Consider the quarterly sales data for Worthington...
Can you please answer this and show the formulas?? Consider the quarterly sales data for Worthington Health Club shown below: Quarter Total Year 1 2 3 4 Sales 1 4 1 3 7 15 2 6 5 2 18 31 3 13 1 7 18 39 4 14 11 6 18 49 5 20 11 13 30 74 Develop a four-period moving average model and compute MSE for your forecasts. Do not round intermediate calculations. Round your answers to two...
Two experienced managers at Wilson Boat Inc. are resisting the introduction of a computerized exponential smoothing...
Two experienced managers at Wilson Boat Inc. are resisting the introduction of a computerized exponential smoothing system, claiming that their judgmental forecasts are much better than any computer could do. Their past record of predictions is as follows: Week Actual Demand Manager's Forecast 1 3,800 4,400 2 4,100 4,800 3 4,300 3,700 4 3,100 3,800 5 3,900 3,500 6 4,500 3,500 7 5,700 4,900 8 4,000 4,700 9 4,500 3,500 10 4,900 5,400 How would the manager’s forecast compare to...
Homework #6 NAME: (State numerical answers #1 Use the leffersonCommunityCollege data set to answe...
 Homework #6 NAME: (State numerical answers #1 Use the leffersonCommunityCollege data set to answer the following questions. #1.1 The 3-period Moving Average forecast for Period 10 is #1.2 The 5-period Moving Average forecast for Period 10 is The MSE, MAE, and MAPE scores for the 3-period and 5-period Moving Average models are: Section: 9:30 12:30 Also put your name on the top of the back of the page Circle one. to four decimal places) 3-period Moving Average S-period Moving Average...
Ch8-A For data of weekly returns (in %) of Google stock given here, forecast the return for the w...
 Ch8-A For data of weekly returns (in %) of Google stock given here, forecast the return for the week of March 5, 2017 as follows. [Note: Express your forecasts in % rounded to to 2 decimal places (eg, 3.23%), and express the MSE's and MAE rounded to 5 decimal places (e.g., 0.00073).] (a) Use a 3-week moving average and find the MSE and MAE. (b) Use exponential smoothing with alpha value 0.3 and compute the error measures (c) Now using...
Consider the following time series data. Week 1 2 3 4 5 6 Value 19 11 16 1017 15 (a) Construct a ...
 Consider the following time series data. Week 1 2 3 4 5 6 Value 19 11 16 1017 15 (a) Construct a time series plot. 20 20 20 18 16 14 12 10 c 14 12 12 0 23 4 5 67 0 23 4 5 67 Week Weck Week 20 18 0 1 2345 6 7 Week What type of pattern exists in the data? The data appear to follow a seasonal pattern. The data appear to follow a...
Examples 1,2,3 1. Beyond Tea Inc. wants to forecast sales of its menthol green tea. The...
 Examples 1,2,3
1. Beyond Tea Inc. wants to forecast sales of its menthol green
tea. The company is considering either using a simple mean or a
three-period moving average to forecast monthly sales. Given sales
data for the past 10 months use both forecasting methods to
forecast periods 7 to 10 and then evaluate each. Which method
should they use? Use the selected method to make a forecast for
month 11. (Show all calculations .... Please read Examples1, 2, 3...
Examples 1,2,3
1. Beyond Tea Inc. wants to forecast sales of its menthol green
tea. The company is considering either using a simple mean or a
three-period moving average to forecast monthly sales. Given sales
data for the past 10 months use both forecasting methods to
forecast periods 7 to 10 and then evaluate each. Which method
should they use? Use the selected method to make a forecast for
month 11. (Show all calculations .... Please read Examples1, 2, 3...
The values of Alabama building contracts (in millions of dollars) for a 12-month period follow. 230 340 230 270 280 320 220 310 240 290 260 
The values of Alabama building contracts (in millions of dollars) for a 12-month period follow. 230 340 230 270 280 320 220 310 240 290 260 230 Choose the correct time series plot. (i) Value (Millions of dollars) Month (t) (ii) Value (Millions of dollars) Month (t) (iii) Value (Millions of dollars) Month (t) (iv) Value (Millions of dollars) Month (t) ________________ What type of pattern exists in the data? ______________ Compare a three-month moving average forecast with an exponential smoothing forecast. Use = 0.2. Which provides the better forecasts based...
Multiple Choice The high level of sales that department stores experience during Christmas is an example...
Multiple Choice The high level of sales that department stores experience during Christmas is an example of what component of a time series? Trend Cyclical Seasonal Irregular Questions 2 – 5 refer to the following time series: Year: 0 1 2 3 4 Sales: 12 14 19 23 18 The value of the three-year centered moving average that corresponds to year 1 will be 15. 14. 18.7. 13.3. The value of the four-year centered...
TEST, I need Help A.S.A.P PLease!!! I need to submit this within the next hour and a half. It's...
1. Regression is always a superior forecasting method to exponential smoothing, so regression should be used whenever the appropriate software is available. (Points :1)TrueFalse2. Time-series models rely on judgment in an attempt to incorporate qualitative or subjective factors into the forecasting model. (Points : 1)TrueFalse3. A trend-projection forecasting method is a causal forecasting method. (Points : 1)TrueFalse4. Qualitative models attempt to incorporate judgmental or subjective factors into the forecasting model. (Points : 1)TrueFalse5. The naive forecast for the next period...
QUESTION 38 Monthly income, in thousands of dollars (SK), at the Acme Law Firm for the...
 QUESTION 38 Monthly income, in thousands of dollars (SK), at the Acme Law Firm for the six-month period from October to March is listed in the table below. month income, $K Oct 69.3 Nov 68.6 Dec 69.4 Jan 71.7 Feb 72.3 Mar 74.8 According to the regression analysis performed for part 41. what is the numerical value of the strength of the linear association between monthly income and month number Round to four (4) decimal places) 0.3587 0.36 1.16 0.1413...
 Homework #6 NAME: (State numerical answers #1 Use the leffersonCommunityCollege data set to answer the following questions. #1.1 The 3-period Moving Average forecast for Period 10 is #1.2 The 5-period Moving Average forecast for Period 10 is The MSE, MAE, and MAPE scores for the 3-period and 5-period Moving Average models are: Section: 9:30 12:30 Also put your name on the top of the back of the page Circle one. to four decimal places) 3-period Moving Average S-period Moving Average...
 Ch8-A For data of weekly returns (in %) of Google stock given here, forecast the return for the week of March 5, 2017 as follows. [Note: Express your forecasts in % rounded to to 2 decimal places (eg, 3.23%), and express the MSE's and MAE rounded to 5 decimal places (e.g., 0.00073).] (a) Use a 3-week moving average and find the MSE and MAE. (b) Use exponential smoothing with alpha value 0.3 and compute the error measures (c) Now using...
 Consider the following time series data. Week 1 2 3 4 5 6 Value 19 11 16 1017 15 (a) Construct a time series plot. 20 20 20 18 16 14 12 10 c 14 12 12 0 23 4 5 67 0 23 4 5 67 Week Weck Week 20 18 0 1 2345 6 7 Week What type of pattern exists in the data? The data appear to follow a seasonal pattern. The data appear to follow a...
 Examples 1,2,3
1. Beyond Tea Inc. wants to forecast sales of its menthol green
tea. The company is considering either using a simple mean or a
three-period moving average to forecast monthly sales. Given sales
data for the past 10 months use both forecasting methods to
forecast periods 7 to 10 and then evaluate each. Which method
should they use? Use the selected method to make a forecast for
month 11. (Show all calculations .... Please read Examples1, 2, 3...
Examples 1,2,3
1. Beyond Tea Inc. wants to forecast sales of its menthol green
tea. The company is considering either using a simple mean or a
three-period moving average to forecast monthly sales. Given sales
data for the past 10 months use both forecasting methods to
forecast periods 7 to 10 and then evaluate each. Which method
should they use? Use the selected method to make a forecast for
month 11. (Show all calculations .... Please read Examples1, 2, 3...
 QUESTION 38 Monthly income, in thousands of dollars (SK), at the Acme Law Firm for the six-month period from October to March is listed in the table below. month income, $K Oct 69.3 Nov 68.6 Dec 69.4 Jan 71.7 Feb 72.3 Mar 74.8 According to the regression analysis performed for part 41. what is the numerical value of the strength of the linear association between monthly income and month number Round to four (4) decimal places) 0.3587 0.36 1.16 0.1413...
Most questions answered within 3 hours.
-
Hypothesis Testing, P-values: For the given
alternate hypothesis (H1) and test statistic
(z), determine the P-value...
asked 51 minutes ago -
#22 Suppose cars pass an intersection at a rate of 120 per hour.
What is the...
asked 4 hours ago -
should software developers who work on critical applications whose
failure could result in loss of human...
asked 1 hour ago -
6. You have a parallel-plate capacitor made of two circular
metal plates. The radius of each...
asked 2 hours ago -
A 1 230.0 kg car traveling initially with a speed of 25.000 m/s
in an easterly...
asked 3 hours ago -
1-how inefficient management affects patient care in a hospital?
2-Thinking as a COO how would you...
asked 3 hours ago -
for project management course
An indicator of project success within an organization is the
strength of...
asked 4 hours ago -
How did immigration affect the culture of the United States?
Explain in detail and give specific...
asked 4 hours ago -
A dolphin in an aquatic show jumps straight up out of the water
at a velocity...
asked 6 hours ago -
x
P(x)
0
0.25
1
0.2
2
0.15
3
0.4
Find the standard deviation of this...
asked 6 hours ago -
An economist claims that he has found evidence to support the
assumption that the investment expenditure...
asked 7 hours ago -
Question 10 (1 point)
Suppose that a researcher studying the weight of female college
athletes wants...
asked 8 hours ago