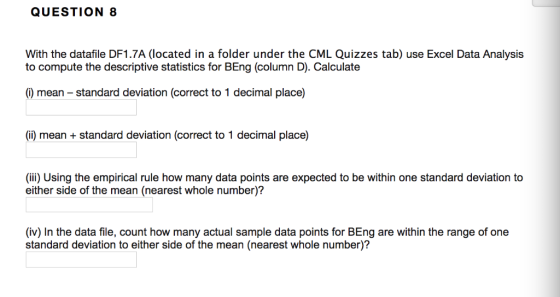
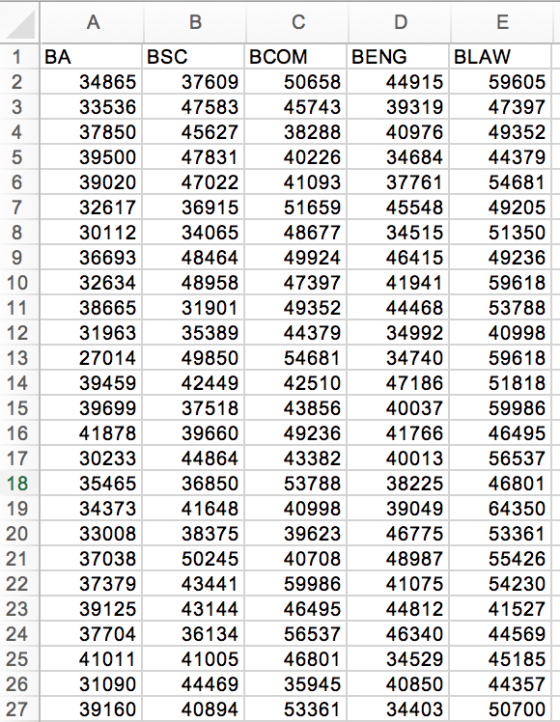
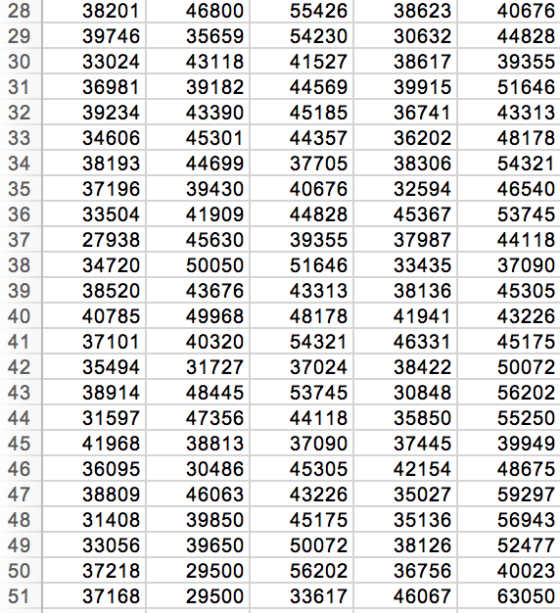
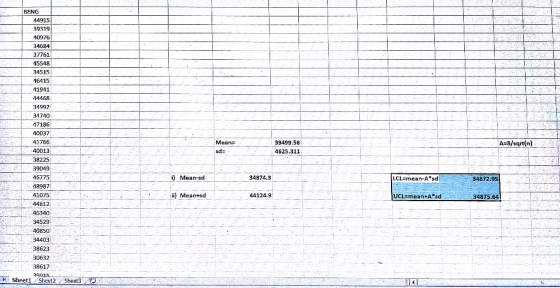
QUESTION 8 With the datafile DF1.7A (located in a folder under the CML Quizzes tab) use Excel Data Analysis to compute the descriptive statistics for BEng (column D). Calculate ) mean standard deviation (correct to 1 decimal place) (i) mean + standard deviation (correct to 1 decimal place) (ii) Using the empirical rule how many data points are expected to be within one standard deviation to either side of the mean (nearest whole number)? (iv) In the data file, count how many actual sample data points for BEng are within the range of one standard deviation to either side of the mean (nearest whole number)?
BSC BCOMBENG BLAW 34865 33536 37850 3950047831 39020 2 37609 47583 45627 50658 45743 38288 40226 39319 40976 34684 37761 59605 47397 49352 44379 54681 4 47022 32617 36915 51659 4554849205 48677 49924 47397 49352 44379 54681 42510 43856 49236 43382 53788 40998 39623 40708 59986 39125 43144 46495 4481241527 56537 34065 48464 48958 36693 32634 38665 31901 31963 2701449850 39459 39699 49236 59618 53788 40998 34740 59618 44468 34992 35389 42449 37518 39660 44864 36850 40037 41766 30233 35465 34373 33008 37038 37379 59986 46495 56537 46801 64350 53361 55426 54230 38225 39049 46775 48987 38375 50245 44569 34529 45185 44357 50700 37704 46340 4100546801 44469 40894 31090 35945 53361 40850 34403
55426 54230 33024 43118 41527 38617 39355 44569 38201 39746 46800 35659 38623 30632 40676 44828 29 30 36981 39234 4339045185 36741 34606 39182 45301 39430 39915 36202 32594 51646 43313 48178 32 44357 38193 446993770538306 54321 40676 33504419094482845367 53745 39355 51646 43313 46540 35 36 37196 27938 34720 38520 4078549968 4817841941 37101 45630 50050 43676 37987 33435 38136 44118 37090 45305 43226 45175 38 39 54321 35494 317273702438422 50072 53745 31597 47356441183585055250 37090 3609530486 45305 42154 48675 43226 314083985045175 35136 56943 50072 56202 33617 40320 48445 38813 46063 46331 30848 37445 35027 42 38914 41968 38809 56202 39949 59297 46 47 48 49 50 33056 37218 37168 39650 29500 29500 38126 36756 46067 52477 40023 63050
Homework Answers
Add Answer to:
NOTE: the simple method of calculating quartiles by hand (taught in class) MUST be used for this ...
NOTE: the simple method of calculating quartiles by hand (taught in class) MUST be used for this ...
 NOTE: the simple method of calculating quartiles by hand (taught in class) MUST be used for this quiz. You may use Kaddstat to check your answer. However, if the answer from your hand calculation and Kaddstat are not the same, you MUST enter your hand calculation answer. DO NOT use any complex algorithms built into calculators, or the Excel function 'quartile' Some questions list data. Type the data into Excel and use the Data Analysis or Kaddstat Boxplot for working....
People in the aerospace industry conducted a pilot study to determine the relationship between the weight...
People in the aerospace industry conducted a pilot study to determine the relationship between the weight and cost of a major object being sent into space. The results of the pilot study are in data file SP13.53, contained in a folder under the CML quizzes tab. Determine the number of observations needed to be 89% confident that the estimate of the average weight is within 0.3 units of the overall mean weight. Note: Assume that the pilot study standard deviation...
a. Time to finish a quiz in minutes follows a normal distribution with mean 6 and...
a. Time to finish a quiz in minutes follows a normal distribution with mean 6 and standard deviation .7. A student took 4.8 minutes. What is this student’s z-score? b. Time to finish a quiz in minutes follows a normal distribution with mean 6 and standard deviation .7. What proportion of students complete the quiz in less than 5.2 minutes? Use the normalcdf command on your calculator with 6 as the mean, .7 as the standard deviation, a very large negative...
PROJECT 3 INSTRUCTIONS Based on Brase & Brase : sections 6.1-6.3 Note that you must do this Visit...
 continuation to previous question
PROJECT 3 INSTRUCTIONS Based on Brase & Brase : sections 6.1-6.3 Note that you must do this Visit the NASDAQ historical prices weblink. First, set the date range to be for exactly 1 year ending on that says "Download Data" to save the file project on your to your computer This project will only use the Close values. Assume that the closing prices of the stock form a normally distributed data set. This means that you...
continuation to previous question
PROJECT 3 INSTRUCTIONS Based on Brase & Brase : sections 6.1-6.3 Note that you must do this Visit the NASDAQ historical prices weblink. First, set the date range to be for exactly 1 year ending on that says "Download Data" to save the file project on your to your computer This project will only use the Close values. Assume that the closing prices of the stock form a normally distributed data set. This means that you...
For this question, you are required to find the standard deviation for a set of data. The answer ...
For this question, you are required to find the standard deviation for a set of data. The answer alone will not achieve full marks. There are many tools available to calculate the standard deviation. Here you are required to use several of the tools and show your working out to earn the marks. The data is the test results of 21 students who sat a mathematics quiz worth 100 marks. Results: 60, 47, 17, 43, 30, 90, 77, 61, 54,...
b) Calculate the standard deviation of the ages for the First Six U.S. Presidents by hand...
 b) Calculate the standard deviation of the ages for the First Six U.S. Presidents by hand by answering the following questions and filling in the table. We will want our final answer to be correct to 3 decimal places. So, to make sure we don't get any rounding error, we will do all calculations to 6 decimal places until the final answer. (1point each) Round each answer to 6 decimal places. (X) of the First Six Presidents? What is the...
Question 8: (12 marks) For this question you are required to find the standard deviation for...
Question 8: (12 marks) For this question you are required to find the standard deviation for a set of data. The answer alone will not achieve full marks. There are many tools available to calculate the standard deviation. Here you are required to use several of the tools and show your working out to earn the marks. The data is the test results of 21 students who sat a mathematics quiz worth 100 marks. Results: 60, 47, 17, 43, 30,...
Use your completed table from part 4b to find the probability that a student correctly answers...
Use your completed table from part 4b to find the probability that a student correctly answers at least one question correctly on the pop quiz. Show your calculations for the answer. Number Correct 0 1 2 3 4 5 6 7 8 Probability 0.1001 0.2670 0.3114 0.2076 0.0865 0.0231 0.0038 0.0004 0.0000 Calculate the mean and standard deviation of this probability distribution. Show your work using the binomial mean and standard deviation formulas and provide your answers with units (rounded...
A) John is doing a math quiz, which has 10 questions where each question has four outcomes (A, B,...
 a) John is doing a math quiz, which has 10 questions where each question has four outcomes (A, B, C & D) but only one is correct. After the quiz, John told you he didn't study for the test at all and guessed all answers. i) If John guessed each and every item in the test, describe the probability distribution for the number of correct guesses. Present the probability distribution in the form of a table using 4 decimal ppints...
 NOTE: the simple method of calculating quartiles by hand (taught in class) MUST be used for this quiz. You may use Kaddstat to check your answer. However, if the answer from your hand calculation and Kaddstat are not the same, you MUST enter your hand calculation answer. DO NOT use any complex algorithms built into calculators, or the Excel function 'quartile' Some questions list data. Type the data into Excel and use the Data Analysis or Kaddstat Boxplot for working....
 NOTE: the simple method of calculating quartiles by hand (taught in class) MUST be used for this quiz. You may use Kaddstat to check your answer. However, if the answer from your hand calculation and Kaddstat are not the same, you MUST enter your hand calculation answer. DO NOT use any complex algorithms built into calculators, or the Excel function 'quartile' Some questions list data. Type the data into Excel and use the Data Analysis or Kaddstat Boxplot for working....
 continuation to previous question
PROJECT 3 INSTRUCTIONS Based on Brase & Brase : sections 6.1-6.3 Note that you must do this Visit the NASDAQ historical prices weblink. First, set the date range to be for exactly 1 year ending on that says "Download Data" to save the file project on your to your computer This project will only use the Close values. Assume that the closing prices of the stock form a normally distributed data set. This means that you...
continuation to previous question
PROJECT 3 INSTRUCTIONS Based on Brase & Brase : sections 6.1-6.3 Note that you must do this Visit the NASDAQ historical prices weblink. First, set the date range to be for exactly 1 year ending on that says "Download Data" to save the file project on your to your computer This project will only use the Close values. Assume that the closing prices of the stock form a normally distributed data set. This means that you...
 b) Calculate the standard deviation of the ages for the First Six U.S. Presidents by hand by answering the following questions and filling in the table. We will want our final answer to be correct to 3 decimal places. So, to make sure we don't get any rounding error, we will do all calculations to 6 decimal places until the final answer. (1point each) Round each answer to 6 decimal places. (X) of the First Six Presidents? What is the...
 a) John is doing a math quiz, which has 10 questions where each question has four outcomes (A, B, C & D) but only one is correct. After the quiz, John told you he didn't study for the test at all and guessed all answers. i) If John guessed each and every item in the test, describe the probability distribution for the number of correct guesses. Present the probability distribution in the form of a table using 4 decimal ppints...
Most questions answered within 3 hours.
-
What does a 2-sided p value of 0.04 mean? (I am not asking if it
is...
asked 6 minutes ago -
A parallel-plate capacitor is made from two aluminum-foil
sheets, each 7.8 cmcm wide and 5.1 mmlong....
asked 8 minutes ago -
1. why is toluene a stronger nucleophile than benzene?
2.why is phenol a stronger nucleophile than...
asked 24 minutes ago -
4. How can you solve for the density of the liquid from the
slope? Please show...
asked 24 minutes ago -
when 2053 j of heat is added to 46.3 g of hexane C6H14 the
temperature increases...
asked 48 minutes ago -
I need new and unique answers, please. (Use your own words,
don't copy and paste), Please...
asked 51 minutes ago -
MCL 445.111 et seq. deals with Home Solicitation Sales.
MCL stands for Michigan Compiled Laws which...
asked 42 minutes ago -
Which of the following items may not create an NOL?
a.
sole proprietorship loss
b.
personal...
asked 47 minutes ago -
A hypothetical solution forms between a solid and a liquid. The
values of the thermodynamic quantities...
asked 45 minutes ago -
a)An ideal heat pump is being considered for use in heating an
environment with a temperature...
asked 48 minutes ago -
.
Convert the following pairs of voltage and current waveforms to
phasor form. Each pair of...
asked 50 minutes ago -
A 6.5 cm diameter ball has a terminal speed of 22 m/s. What is
the ball's...
asked 1 hour ago