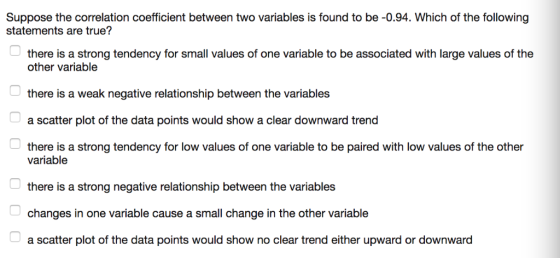
Suppose the correlation coefficient between two variables is found to be -0.94. Which of the following statements are true? there is a strong tendency for small values of one variable to be associated with large values of the other variable there is a weak negative relationship between the variables a scatter plot of the data points would show a clear downward trend there is a strong tendency for low values of one variable to be paired with low values of the other variable there is a strong negative relationship between the variables changes in one variable cause a small change in the other variable a scatter plot of the data points would show no clear trend either upward or downward
Homework Answers
The value of correlation coefficient is from -1 to 1.
We will analyze each statement.
Statement 1: True, because it has a negative sign, which shows inverse relation and also the value is close to -1, so it shows a strong inverse, negative relation.
Statement 2: False, there is a negative relation but it is not weak, the value is near to -1, which shows strong negative relation.
Statement 3: True, because the value is negative, shows inverse relation between two variables.
Statement 4: False, it has negative sign, so shows large value of one variable is associated with lower values of another variable.
Statement 5: True, there is a strong negative relation between two variables because the value is negative and near to -1.
Statement 6: False, changes in one variable would cause higher changes in another variable because it is strong negative relation.
Statement 7: False, the scatter chart would show a clear downward trend because of a negative relation between two variables.
Add Answer to:
NOTE: the simple method of calculating quartiles by hand (taught in class) MUST be used for this ...
NOTE: the simple method of calculating quartiles by hand (taught in class) MUST be used for this ...
 NOTE: the simple method of calculating quartiles by hand (taught in class) MUST be used for this quiz. You may use Kaddstat to check your answer. However, if the answer from your hand calculation and Kaddstat are not the same, you MUST enter your hand calculation answer. DO NOT use any complex algorithms built into calculators, or the Excel function 'quartile' Some questions list data. Type the data into Excel and use the Data Analysis or Kaddstat Boxplot for working....
QUESTION 6 Suppose the correlation coefficient between two variables is found to be -0.94. Which of...
 QUESTION 6 Suppose the correlation coefficient between two variables is found to be -0.94. Which of the following statements are true? there is a strong tendency for small values of one variable to be associated with large values of the other variable there is a weak negative relationship between the variables a scatter plot of the data points would show a clear downward trend there is a strong tendency for low values of one variable to be paired with low...
Show work including formulas used and tables, must be done by hand. Using the following table...
Show work including formulas used and tables, must be done by hand. Using the following table of relation between X & Y (Y is the independent Variable): xi -2 2 4 5 4 6 7 8 11 yi -4 1 3 1 3 8 10 20 30 Find the estimated regression equation. Show ALL your calculations and the appropriate formula. WRITE Formula in all the questions below and substitute for the numbers, demonstrate your work. Calculate R2. Comment on the...
How does the fuel consumption of a car change as its speed increases? The table contains...
How does the fuel consumption of a car change as its speed increases? The table contains data for a 2014 Chevrolet Cruze Turbo Diesel. Speed is measured in miles per hour, and fuel consumption is measured in miles per gallon. Speed 10 20 30 40 50 60 70 80 Fuel 38.1 54.0 68.4 63.6 60.5 55.4 50.6 43.8 To access the complete data set, click the link for your preferred software format: Excel Minitab JMP SPSS TI R Mac-TXT PC-TXT...
please look at all pics posted Round all values to the nearest single decimal point. Note that due to rounding y...
 please look at all pics posted
Round all values to the nearest single decimal point. Note that due to rounding you will not get SST-SSR+SSE exactly, but it should be fairly close. A researcher collected data on the hours of TV watched per day from a sample of five people of different ages. Here are the results: Age TV Hrs 43 2 30 3 4 4 20 3 What is the independent variable in this study? C TV Hours C...
please look at all pics posted
Round all values to the nearest single decimal point. Note that due to rounding you will not get SST-SSR+SSE exactly, but it should be fairly close. A researcher collected data on the hours of TV watched per day from a sample of five people of different ages. Here are the results: Age TV Hrs 43 2 30 3 4 4 20 3 What is the independent variable in this study? C TV Hours C...
PART 4 For the part we are going to explore a new set of data. Is...
 PART 4 For the part we are going to explore a new set of data. Is there any reason to think that there is a relationship between number of cousins a student has and number of hours th student worked? Let's do some data mining and find out if there is a relationship in ou sample. The following chart shows sample data for ten observations. The blank colur in the chart can be used to help you organize your calculations,...
Homework 4 Use the hand span data that we collected in class for homework Suppose you...
Homework 4 Use the hand span data that we collected in class for homework Suppose you want to buy someone a pair of love, but you do not know their love size. Usually, we do have a pretty good idea of the person's height. Let' asume that the right hand span is a rood indicator of the love size. So let find the best predictor of right hand span be on the person's height. Once we can predict the right...
. .NEED ANSWER ASAP / ANSWER NEVER USED BEFORE, COMPLETELY NEW ANSWER PLEASE a.) Find the...
. .NEED ANSWER ASAP / ANSWER NEVER USED BEFORE, COMPLETELY NEW ANSWER PLEASE a.) Find the following values, using the equations, and then work the problems using a financial calculator to check your answers. Disregard rounding differences. (Hint: If you are using a financial calculator, you can enter the known values and then press the appropriate key to find the unknown variable. Then, without clearing the TVM register, you can "override" the variable that changes by simply entering a new...
 NOTE: the simple method of calculating quartiles by hand (taught in class) MUST be used for this quiz. You may use Kaddstat to check your answer. However, if the answer from your hand calculation and Kaddstat are not the same, you MUST enter your hand calculation answer. DO NOT use any complex algorithms built into calculators, or the Excel function 'quartile' Some questions list data. Type the data into Excel and use the Data Analysis or Kaddstat Boxplot for working....
 NOTE: the simple method of calculating quartiles by hand (taught in class) MUST be used for this quiz. You may use Kaddstat to check your answer. However, if the answer from your hand calculation and Kaddstat are not the same, you MUST enter your hand calculation answer. DO NOT use any complex algorithms built into calculators, or the Excel function 'quartile' Some questions list data. Type the data into Excel and use the Data Analysis or Kaddstat Boxplot for working....
 QUESTION 6 Suppose the correlation coefficient between two variables is found to be -0.94. Which of the following statements are true? there is a strong tendency for small values of one variable to be associated with large values of the other variable there is a weak negative relationship between the variables a scatter plot of the data points would show a clear downward trend there is a strong tendency for low values of one variable to be paired with low...
 please look at all pics posted
Round all values to the nearest single decimal point. Note that due to rounding you will not get SST-SSR+SSE exactly, but it should be fairly close. A researcher collected data on the hours of TV watched per day from a sample of five people of different ages. Here are the results: Age TV Hrs 43 2 30 3 4 4 20 3 What is the independent variable in this study? C TV Hours C...
please look at all pics posted
Round all values to the nearest single decimal point. Note that due to rounding you will not get SST-SSR+SSE exactly, but it should be fairly close. A researcher collected data on the hours of TV watched per day from a sample of five people of different ages. Here are the results: Age TV Hrs 43 2 30 3 4 4 20 3 What is the independent variable in this study? C TV Hours C...
 PART 4 For the part we are going to explore a new set of data. Is there any reason to think that there is a relationship between number of cousins a student has and number of hours th student worked? Let's do some data mining and find out if there is a relationship in ou sample. The following chart shows sample data for ten observations. The blank colur in the chart can be used to help you organize your calculations,...
Most questions answered within 3 hours.
-
can someone please explain for me in any easy way what does
Dipole mean ?
asked 3 minutes ago -
Consider the following grammar:
<S> → <A> a <B> b
<A> → <A> b | b...
asked 3 minutes ago -
Chapter’s 2 “Dominos Sizzles with Pizza Tracker” Case Study.
Ansewer the following questions:
1) What kinds...
asked 6 minutes ago -
It's a snowy day and you're pulling a friend along a level road
on a sled....
asked 5 minutes ago -
4.14D Select a diameter of a steel driveshaft
that transmits 250 hp at 5000 rpm. Bending...
asked 11 minutes ago -
1 4 7 10
2 5 8 11
3 6 9 12
I want to print...
asked 10 minutes ago -
In a statistics class there are 12 students. Five of the
students are seniors and the...
asked 13 minutes ago -
Preparation of Cyclohexene From
Cyclohexanol
organic chemistry
What is the function of each of the following...
asked 34 minutes ago -
***EDIT: This was all the data that was provided.
Please show all work and formulas used!...
asked 36 minutes ago -
Assume that when adults with smartphones are randomly selected,
48% use them in meetings or classes....
asked 1 hour ago -
A motor spins up from rest to an angular velocity of 165 rad/s
in 1.2 s....
asked 52 minutes ago -
An entomologist sprayed 120 adult Melon flies with a specific
low concentration of malathion and observed...
asked 56 minutes ago