The number of disk drives (in millions) made at a plant in Taiwan during the past 5 years follows...
The number of disk drives (in millions) made at a plant in Taiwan during the past 5 years follows:
| YEAR | DISK DRIVES |
|---|---|
| 1 | 140 |
| 2 | 160 |
| 3 | 190 |
| 4 | 200 |
| 5 | 210 |
-
Forecast the number of disk drives to be made next year, using linear regression.
-
Compute the mean squared error (MSE) when using linear regression.
-
Compute the mean absolute percent error (MAPE).
Homework Answers


Add Answer to:
The number of disk drives (in millions) made at a plant in Taiwan during the past 5 years follows...
Please provide hand-written explanation • 4.29 The number of disk drives (in millions) made at a plant in Taiwan dur...
 Please provide hand-written explanation
• 4.29 The number of disk drives (in millions) made at a plant in Taiwan during the past 5 years follows: YEAR DISK DRIVES 140 160 nm + L 190 200 210 a) Forecast the number of disk drives to be made next year, using linear regression. b) Compute the mean squared error (MSE) when using linear regression. c) Compute the mean absolute percent error (MAPE). PX
Please provide hand-written explanation
• 4.29 The number of disk drives (in millions) made at a plant in Taiwan during the past 5 years follows: YEAR DISK DRIVES 140 160 nm + L 190 200 210 a) Forecast the number of disk drives to be made next year, using linear regression. b) Compute the mean squared error (MSE) when using linear regression. c) Compute the mean absolute percent error (MAPE). PX
The number of internal disk drives (in millions) made at a plant in Taiwan during the...
The number of internal disk drives (in millions) made at a plant in Taiwan during the past 5 years follows: year 1: 142 year 2: 156 year 3: 184 year 4: 200 year 5: 210 A) Using simple linear regression, the forecast for the number of disk drives to be made next year is.. ___ disk drives (round to one decimal place) B) What is the MSE (Mean Squared Error)? Round to one decimal place C) What is the MAPE...
The number of internal disk drives (in millions) made at a plant in Taiwan during the...
The number of internal disk drives (in millions) made at a plant in Taiwan during the past 5 years follows: Year Disk Drives 1 142 2 156 3 184 4 204 5 210 a) Using simple linear regression, the forecast for the number of disk drives to be made next year = disk drives (round your response to one decimal place). b) The mean squared error (MSE) when using simple linear regression = drives squareddrives2 (round your response to...
The number of internal disk drives (in millions) made at a plant in Taiwan during the...
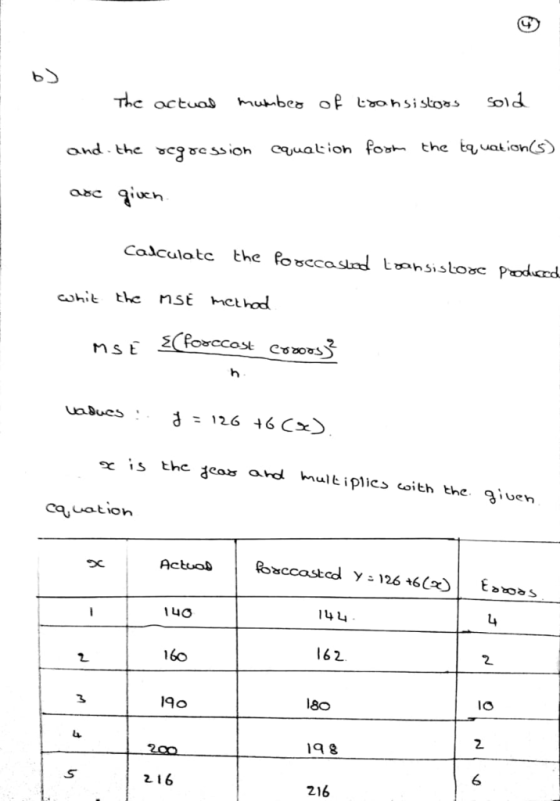
The number of internal disk drives (in millions) made at a plant in Taiwan during the past 5 years follows: Year Disk Drives 1 140140 2 156156 3 190190 4 202202 5 216216 a) Using simple linear regression..., the forecast for the number of disk drives to be made next year = 240.2 disk drives (round your response to one decimal place). b) The mean squared error (MSE) when using simple linear regression = ????drives^2 (round your response to...
The number of internal disk drives (in milions) made at a plant in Talwan during the...
 The number of internal disk drives (in milions) made at a plant in Talwan during the past 5 years follows: Disk Drives 142 156 196 204 216 Year a) Using simple linear regression, the forecast for the number of disk drives to be made next year disk drives (round your response to one decimal place) b) The mean squared error(MSE) when using simple inear c) The mean absolute percentage error (MAPE) when using simple linear regression . regressiondrives (round your...
Problem 15-03 (Algorithmic) Consider the following time series data. Week 1 2 3 4 5 6...
Problem 15-03 (Algorithmic) Consider the following time series data. Week 1 2 3 4 5 6 Value 18 14 16 11 17 13 Using the naïve method (most recent value) as the forecast for the next week, compute the following measures of forecast accuracy: Mean absolute error (MAE) Mean squared error (MSE) Mean absolute percentage error (MAPE) Round your answers to two decimal places. MAE = MSE = MAPE = Using the average of all the historical data as a...
Please help Consider the following time series data. 3 4 5 6 Week 12 18 14...
 Please help
Consider the following time series data. 3 4 5 6 Week 12 18 14 Value 17 1018 15 Using the average of all the historical data as a forecast for the next period, compute the following measures of forecast accuracy. (Round your answers to two decimal places.) (a) mean absolute error MAE - (b) mean squared error MSE - (c) mean absolute percentage error MAPE 96 (d) What is the forecast for week 7?
Please help
Consider the following time series data. 3 4 5 6 Week 12 18 14 Value 17 1018 15 Using the average of all the historical data as a forecast for the next period, compute the following measures of forecast accuracy. (Round your answers to two decimal places.) (a) mean absolute error MAE - (b) mean squared error MSE - (c) mean absolute percentage error MAPE 96 (d) What is the forecast for week 7?
During the past five months the emergency room at the new district Hospital has observed the...
 During the past five months the emergency room at the new district Hospital has observed the number of patients during the weekend (Friday through Sunday). They typically experience greater patient traffic on weekends than during the week. Week No of Patients 105 119 122 128 117 136 141 126 143 140 a) Compute a weighted three-period moving average forecast, using weights of 3, 2, and 1 for the most recent, next recent, and most distant data. (4 marks) b) What...
A. Use a 3-year moving average to forecast the quantity of fish for the years 1983 through 2006 for these data...
 A. Use a 3-year moving average to forecast the quantity of fish for the years 1983 through 2006 for these data. Compute the error of each forecast and then determine the mean absolute deviation of error for the forecast. B. Use exponential smoothing and a = 0.2 to forecast the data through 2006. Let the forecast for 1981 equal the actual value for 1980. Compute the error of each forecast and then determine the mean absolute deviation of error for...
1Year Sales (in $1000s) 283 288 336 388 406 412 416 435 428 435 462 452...
 1Year Sales (in $1000s) 283 288 336 388 406 412 416 435 428 435 462 452 474 476 497 487 523 528 532 552 4 4 6 6 9 10 11 10 12 11 13 12 14 13 1514 16 15 17 16 18 17 19 18 20 19 21 20 23 24 Module 2 Assisted Problems Note: Data for these problems are in the Module 2 Assisted Assignments Data file-there is a tab for each problem. All answers should...
 Please provide hand-written explanation
• 4.29 The number of disk drives (in millions) made at a plant in Taiwan during the past 5 years follows: YEAR DISK DRIVES 140 160 nm + L 190 200 210 a) Forecast the number of disk drives to be made next year, using linear regression. b) Compute the mean squared error (MSE) when using linear regression. c) Compute the mean absolute percent error (MAPE). PX
Please provide hand-written explanation
• 4.29 The number of disk drives (in millions) made at a plant in Taiwan during the past 5 years follows: YEAR DISK DRIVES 140 160 nm + L 190 200 210 a) Forecast the number of disk drives to be made next year, using linear regression. b) Compute the mean squared error (MSE) when using linear regression. c) Compute the mean absolute percent error (MAPE). PX
 The number of internal disk drives (in milions) made at a plant in Talwan during the past 5 years follows: Disk Drives 142 156 196 204 216 Year a) Using simple linear regression, the forecast for the number of disk drives to be made next year disk drives (round your response to one decimal place) b) The mean squared error(MSE) when using simple inear c) The mean absolute percentage error (MAPE) when using simple linear regression . regressiondrives (round your...
 Please help
Consider the following time series data. 3 4 5 6 Week 12 18 14 Value 17 1018 15 Using the average of all the historical data as a forecast for the next period, compute the following measures of forecast accuracy. (Round your answers to two decimal places.) (a) mean absolute error MAE - (b) mean squared error MSE - (c) mean absolute percentage error MAPE 96 (d) What is the forecast for week 7?
Please help
Consider the following time series data. 3 4 5 6 Week 12 18 14 Value 17 1018 15 Using the average of all the historical data as a forecast for the next period, compute the following measures of forecast accuracy. (Round your answers to two decimal places.) (a) mean absolute error MAE - (b) mean squared error MSE - (c) mean absolute percentage error MAPE 96 (d) What is the forecast for week 7?
 During the past five months the emergency room at the new district Hospital has observed the number of patients during the weekend (Friday through Sunday). They typically experience greater patient traffic on weekends than during the week. Week No of Patients 105 119 122 128 117 136 141 126 143 140 a) Compute a weighted three-period moving average forecast, using weights of 3, 2, and 1 for the most recent, next recent, and most distant data. (4 marks) b) What...
 A. Use a 3-year moving average to forecast the quantity of fish for the years 1983 through 2006 for these data. Compute the error of each forecast and then determine the mean absolute deviation of error for the forecast. B. Use exponential smoothing and a = 0.2 to forecast the data through 2006. Let the forecast for 1981 equal the actual value for 1980. Compute the error of each forecast and then determine the mean absolute deviation of error for...
 1Year Sales (in $1000s) 283 288 336 388 406 412 416 435 428 435 462 452 474 476 497 487 523 528 532 552 4 4 6 6 9 10 11 10 12 11 13 12 14 13 1514 16 15 17 16 18 17 19 18 20 19 21 20 23 24 Module 2 Assisted Problems Note: Data for these problems are in the Module 2 Assisted Assignments Data file-there is a tab for each problem. All answers should...
Most questions answered within 3 hours.
-
New Air Heating and Cooling, manufactures furnaces and central
air units. The company pride itself on...
asked 11 minutes ago -
A coach uses a new technique to train gymnasts. Seven
gymnasts were randomly selected and their...
asked 2 hours ago -
While rotating the tires on your car you notice a rock [mass =
0.1 Kg] stuck...
asked 4 hours ago -
Using MARS simulator, write MIPS programs according to
the following scenarios: Receive a positive integer number...
asked 5 hours ago -
An object in front of a concave mirror has a real image that is
11.5 cm...
asked 6 hours ago -
Consider the reaction, C3 H8 + O2 --> CO2 + H2O. How many
moles of O2...
asked 7 hours ago -
You and your opponent both roll a fair die. If you both roll the
same number,...
asked 8 hours ago -
In a study of the accuracy of fast food drive-through orders,
Restaurant A had 257 accurate...
asked 8 hours ago -
Identify and describe in detail the four categories of
institutions that could be included in a...
asked 8 hours ago -
In python
class Customer:
def __init__(self, customer_id, last_name, first_name, phone_number, address):
self._customer_id = int(customer_id)
self._last_name =...
asked 8 hours ago -
What is an example of a limitation in implementing a new
ERP system and how it...
asked 8 hours ago -
In a section of 9.7cm of an artery with a radius of 2.6mm there
is a...
asked 8 hours ago