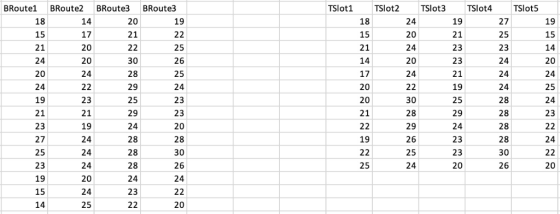
TSlot2 TSlot3 TSlot4 TSlot5 18 TSlot1 19 15 14 20 24 25 24 23 27 BRoute1 BRoute2BRoute3 BRoute3 14 24 20 24 20 24 25 23 24 24 24 28 28 28 28 30 26 20 19 18 15 23 23 25 26 25 24 23 23 20 20 20 24 30 28 29 25 29 24 28 28 28 24 24 20 24 19 17 20 20 25 29 30 23 21 19 24 24 24 20 24 25 29 26 25 24 24 23 23 20 19 23 27 25 23 19 15 14 20 30 26 24 25 23 20
Homework Answers

Add Answer to:
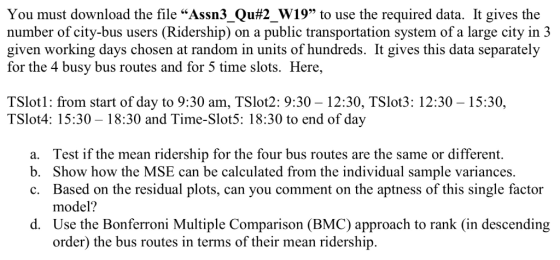
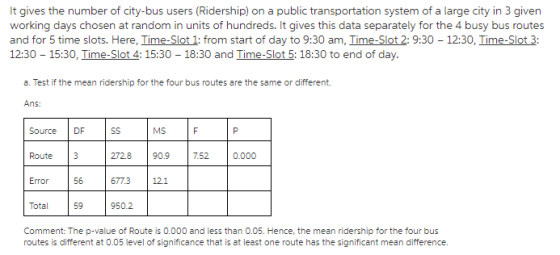
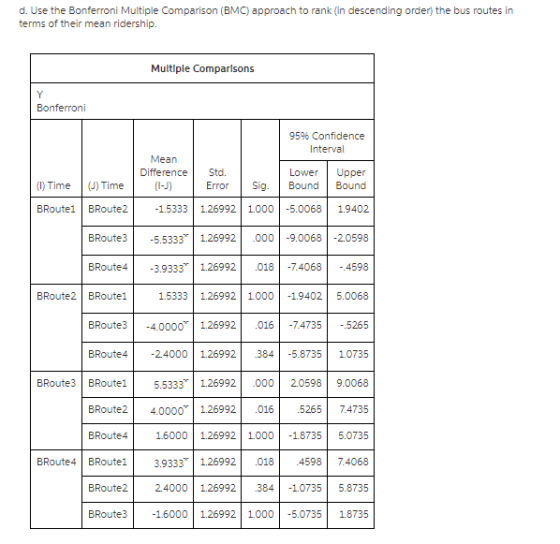
You must download the file "Assn3Ou#2W19" to use the required data. Ît gives the number of city-b...
Problem 1 While performing scheduling work on a project you have determined that one activity has...
 Problem 1 While performing scheduling work on a project you have determined that one activity has a great deal of variability. A sample of times (30) the task has been completed is provided the table below. Assume that the task is considered to be "late" if the task duration is two days greater than the mean value (rounded to the nearest whole day), and "early" if the task duration is two days less than the mean value (rounded to the...
Therefore, for this program you will read the data in the file named weatherdata_2.txt into arrays...
Therefore, for this program you will read the data in the file named weatherdata_2.txt into arrays for the wind speed and for the temperature. You will then use the stored data to calculate and output the average wind speed and the average temperature. Create a constant with a value of 30 and use that to declare and loop through your arrays and as a divisor to produce your averages. Here is the data file (below). 1. 14 25 2. 12...
A soft drink manufacturer uses fire agents to handle premium distribution for is various products. The marketing director desired to study the timeliness with which the premiums are distributed. Twent...
A soft drink manufacturer uses fire agents to handle premium distribution for is various products. The marketing director desired to study the timeliness with which the premiums are distributed. Twenty transactions for each agent were selected at random and the time lapse (in days) for handling each transaction was determined. The results follow: Agent 1 Agent 2 Agent 3 Agent 4 Agent 5 24 18 10 15 33 24 20 11 13 22 29 20 8 18 28 20 24...
Assembly Language Programming Assignment program must be in: MASM assembly language / x86 architecture / irvine...
Assembly Language Programming Assignment program must be in: MASM assembly language / x86 architecture / irvine library procedures Objectives: 1. using register indirect addressing 2. passing parameters 3. generating “random” numbers 4. working with arrays Description: Write and test a MASM program to perform the following tasks: 1. Introduce the program. 2. Generate ARRAYSIZE random integers in the range [LO = 10 .. HI = 29], storing them in consecutive elements of an array. ARRAYSIZE should be set to 200....
1 The following data represents the number of innings pitched by the ERA leaders for the...
 1 The following data represents the number of innings pitched by the ERA leaders for the past few years 23, 30, 20, 27, 44, 26, 35, 20, 29. 29, 25, 15, 18, 27, 19, 22, 12, 26. 34. 15. 27, 35, 26, ald43 35, 14, 24, 12, 23. 31, 40. 35, 38, 57, 22. 42, 24, 21, 27, 33 1. Find the value that corresponds to the 70th percentile. 2. Identify all the outiiers 3. Construct a boxplot for the...
1 A measurement systems experiment involving 20 parts, three operators, and two measurements per ...
 1 A measurement systems experiment involving 20 parts, three operators, and two measurements per part is shown in Table 8E. 12. (a) Estimate the repeatability and reproducibility of the gauge (b) What is the estimate of total gauge variability? (c) If the product specifications are at LSL 6 and USIL - 60, what ca you say about gauge capa bility? TABLE 8E. 12 Measurement Data for Exercise 8.34 Operator 1 Operator 2 Operator 3 Measurements Measurements Measurements Part Number 1...
1. You are the new data scientist for Fitbit. When viewing the Google Analytics account associate...
 1. You are the new data scientist for Fitbit.
When viewing the Google Analytics account associated with the
Fitbit website., you notice that the Average Time on Site is 82
seconds.
- Describe 4 different ways you can provide context for this
metric.
- For the sub-activity, refer to the attachment below entitled,
"Image_Module_11.jpg" (the image is also embedded within the text
below). Imagine that you have created an email campaign designed to
drive users to your site. The email...
1. You are the new data scientist for Fitbit.
When viewing the Google Analytics account associated with the
Fitbit website., you notice that the Average Time on Site is 82
seconds.
- Describe 4 different ways you can provide context for this
metric.
- For the sub-activity, refer to the attachment below entitled,
"Image_Module_11.jpg" (the image is also embedded within the text
below). Imagine that you have created an email campaign designed to
drive users to your site. The email...
Question: 3.897 21 3.885 14 3.778 28 2.540&n... 3.897 21 3.885 14 3.778 28 2.540 22...
Question: 3.897 21 3.885 14 3.778 28 2.540&n... 3.897 21 3.885 14 3.778 28 2.540 22 3.028 21 3.865 31 2.962 32 3.961 27 0.500 29 3.178 26 3.310 24 3.538 30 3.083 24 3.013 24 3.245 33 2.963 27 3.522 25 3.013 31 2.947 25 2.118 20 2.563 24 3.357 21 3.731 28 3.925 27 3.556 28 3.101 26 2.420 28 2.579 22 3.871 26 3.060 21 3.927 25 2.375 16 2.929 28 3.375 26 2.857 22 3.072 24...
Question #5: A statistics teacher wants to see whether there is a statistically significant difference in...
 Question #5: A statistics teacher wants to see whether there is a statistically significant difference in the ages of day students and night students. A random sample of 31 students is selected from each group. The data are given below. Test the claim that there is difference in the mean ages of the two groups. Use a 0.01 Day Students: 22 24 24 23 19 19 23 22 18 21 21 18 18 25 29 24 23 22 22 21...
Solve using Minitab. The table is observations on weekly operational downtime on a critical equipment (order...
 Solve using Minitab.
The table is observations on weekly operational downtime on a critical equipment (order read top to bottom and left to right). The target value for the mean is 25. (a) Estimate the process standard deviation. (b) Set up and apply a tabular cusum chart for this process using standardized values h 5 and k = 2. (c) Interpret the cusum chart - 27 24 22 27 25 27 23 20 28 29 24 28 20 29 21...
Solve using Minitab.
The table is observations on weekly operational downtime on a critical equipment (order read top to bottom and left to right). The target value for the mean is 25. (a) Estimate the process standard deviation. (b) Set up and apply a tabular cusum chart for this process using standardized values h 5 and k = 2. (c) Interpret the cusum chart - 27 24 22 27 25 27 23 20 28 29 24 28 20 29 21...
 Problem 1 While performing scheduling work on a project you have determined that one activity has a great deal of variability. A sample of times (30) the task has been completed is provided the table below. Assume that the task is considered to be "late" if the task duration is two days greater than the mean value (rounded to the nearest whole day), and "early" if the task duration is two days less than the mean value (rounded to the...
 1 The following data represents the number of innings pitched by the ERA leaders for the past few years 23, 30, 20, 27, 44, 26, 35, 20, 29. 29, 25, 15, 18, 27, 19, 22, 12, 26. 34. 15. 27, 35, 26, ald43 35, 14, 24, 12, 23. 31, 40. 35, 38, 57, 22. 42, 24, 21, 27, 33 1. Find the value that corresponds to the 70th percentile. 2. Identify all the outiiers 3. Construct a boxplot for the...
 1 A measurement systems experiment involving 20 parts, three operators, and two measurements per part is shown in Table 8E. 12. (a) Estimate the repeatability and reproducibility of the gauge (b) What is the estimate of total gauge variability? (c) If the product specifications are at LSL 6 and USIL - 60, what ca you say about gauge capa bility? TABLE 8E. 12 Measurement Data for Exercise 8.34 Operator 1 Operator 2 Operator 3 Measurements Measurements Measurements Part Number 1...
 1. You are the new data scientist for Fitbit.
When viewing the Google Analytics account associated with the
Fitbit website., you notice that the Average Time on Site is 82
seconds.
- Describe 4 different ways you can provide context for this
metric.
- For the sub-activity, refer to the attachment below entitled,
"Image_Module_11.jpg" (the image is also embedded within the text
below). Imagine that you have created an email campaign designed to
drive users to your site. The email...
1. You are the new data scientist for Fitbit.
When viewing the Google Analytics account associated with the
Fitbit website., you notice that the Average Time on Site is 82
seconds.
- Describe 4 different ways you can provide context for this
metric.
- For the sub-activity, refer to the attachment below entitled,
"Image_Module_11.jpg" (the image is also embedded within the text
below). Imagine that you have created an email campaign designed to
drive users to your site. The email...
 Question #5: A statistics teacher wants to see whether there is a statistically significant difference in the ages of day students and night students. A random sample of 31 students is selected from each group. The data are given below. Test the claim that there is difference in the mean ages of the two groups. Use a 0.01 Day Students: 22 24 24 23 19 19 23 22 18 21 21 18 18 25 29 24 23 22 22 21...
 Solve using Minitab.
The table is observations on weekly operational downtime on a critical equipment (order read top to bottom and left to right). The target value for the mean is 25. (a) Estimate the process standard deviation. (b) Set up and apply a tabular cusum chart for this process using standardized values h 5 and k = 2. (c) Interpret the cusum chart - 27 24 22 27 25 27 23 20 28 29 24 28 20 29 21...
Solve using Minitab.
The table is observations on weekly operational downtime on a critical equipment (order read top to bottom and left to right). The target value for the mean is 25. (a) Estimate the process standard deviation. (b) Set up and apply a tabular cusum chart for this process using standardized values h 5 and k = 2. (c) Interpret the cusum chart - 27 24 22 27 25 27 23 20 28 29 24 28 20 29 21...
Most questions answered within 3 hours.
-
Batteries are one of the major imports of the US from China.
Batteries cost 10 Yuan...
asked 1 minute from now -
the
Kb of ammonia (NH3) at 25.0 C is 1.75 x 10⁻⁵. Calculate the pH of...
asked 6 minutes ago -
aluminum maker Alcoa has a beta of about 1.86, whereas Hormel
Foods has a beta of...
asked 16 minutes ago -
Hewtex Electronics manufactures two products, headsets and
electronic calculators, and sells them nationally to wholesalers
and...
asked 18 minutes ago -
PHP
Create an HTML Form that asks for a series of
personal information from the user,...
asked 9 minutes ago -
The cash account for American Medical Co. at April 30 indicated
a balance of $10,785. The...
asked 15 minutes ago -
Describe how to measure benefits, including specific examples of
clinical and financial benefits that can be...
asked 31 minutes ago -
Costs associated with the manufacture of miniature
high-sensitivity piezoresistive pressure transducers is $74,000 per
year. A...
asked 46 minutes ago -
Given the following information for Jane Cole complete schedule
D of 1040 through part III and...
asked 45 minutes ago -
Why doesn't a small piece of uranium go naturally into a chain
reaction?
A) A small...
asked 50 minutes ago -
Last year’s freshman class at Big State University totaled 5,324
students. Of those, 1,254 received a...
asked 58 minutes ago -
The transverse displacement of a stretched string from
equilibrium as a function of time and position...
asked 1 hour ago