


4. Comparing models Based on all models run, which model do you feel best predicts future trends? Explain your rationale. Based on the model selected, what type of seasonal adjustments,if any, would be required to meet customer needs? a. b.
26 27 28 29 30 31 32 33 34 35 36 37 38 39 40 41 42 43 44 5 6 7 8 49 50 5 5 5 54 55 56 57 58 59 6 6 6 6 6 65 66 67 68 69
2 2 0123456
Homework Answers


Add Answer to:
The first two are the instructions to the assignment and the last two are the data
WalMart’s fiscal year starts the first week of February. This means that when analyzing the data,...
WalMart’s fiscal year starts the first week of February. This means that when analyzing the data, week 26 is actually week 30 (26+4 weeks for January) in 2002 or the end of July 2002. Also, week 52 is actually week 4 (52+4 weeks for January 2002 minus 52 weeks for 2002) in 2003 or the end of January 2003. As an example, the spike in sales (revenue) at week 75 occurs in week 27 (75+4 weeks for January 2002 minus...
Note that WalMart’s fiscal year starts the first week of February. This means that when analyzing...
Note that WalMart’s fiscal year starts the first week of February. This means that when analyzing the data, week 26 is actually week 30 (26+4 weeks for January) in 2002 or the end of July 2002. Also, week 52 is actually week 4 (52+4 weeks for January 2002 minus 52 weeks for 2002) in 2003 or the end of January 2003. Outliers (extreme values) are present in the data and can distort modeling results. As an example, spikes in sales...
Note that WalMart’s fiscal year starts the first week of February.
Note that WalMart’s fiscalyear starts the first week of February. This means that when analyzing the data, week 26 is actuallyweek 30 (26+4 weeks for January) in 2002 or the end of July 2002. Also, week 52 is actually week 4(52+4 weeks for January 2002 minus 52 weeks for 2002) in 2003 or the end of January 2003. Outliers(extreme values) are present in the data and can distort modeling results. As an example, spikes in sales(revenue) at weeks 28-30 occurs...
The WalMart’s fiscal year starts the first week of February. This means that when analyzing the...
The WalMart’s fiscal year starts the first week of February. This means that when analyzing the data, week 26 is actually week 30 (26+4 weeks for January) in 2002 or the end of July 2002. Also, week 52 is actually week 4 (52+4 weeks for January 2002 minus 52 weeks for 2002) in 2003 or the end of January 2003. As an example, the spike in sales (revenue) at week 75 occurs in week 27 (75+4 weeks for January 2002...
The WalMart’s fiscal year starts the first week of February. This means that when analyzing the d...
The WalMart’s fiscal year starts the first week of February. This means that when analyzing the data, week 26 is actually week 30 (26+4 weeks for January) in 2002 or the end of July 2002. Also, week 52 is actually week 4 (52+4 weeks for January 2002 minus 52 weeks for 2002) in 2003 or the end of January 2003. As an example, the spike in sales (revenue) at week 75 occurs in week 27 (75+4 weeks for January 2002...
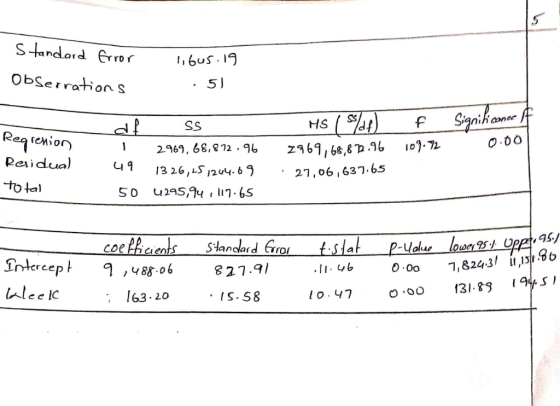
Project #2 Wal*Mart Dry Goods Sales 2003-2004 The following items are a guide for responses to be addressed in project two. Note that WalMart’s fiscal year starts the first week of February. This means that when analyzing the data, week 41 is actually w
Project #2Wal*Mart Dry Goods Sales 2003-2004The following items are a guide for responses to be addressed in project two. Note that WalMart’s fiscal year starts the first week of February. This means that when analyzing the data, week 41 is actually week 45 (41+4 weeks for January) in 2003 or the beginning of November 2003. Also, week 52 is actually week 4 (52+4 weeks for January 2003 minus 52 weeks for 2003) in 2004 or the end of January 2004. ...
Week Sales 26 15200 27 15600 28 16400 29 15600 30 14200 31 14400 32 16400 33 15200 34 14400 35 13...
Week Sales 26 15200 27 15600 28 16400 29 15600 30 14200 31 14400 32 16400 33 15200 34 14400 35 13800 36 15000 37 14100 38 14400 39 14000 40 15600 41 15000 42 14400 43 17800 44 15000 45 15200 46 15800 47 18600 48 15400 49 15500 50 16800 51 18700 52 21400 53 20900 54 18800 55 22400 56 19400 57 20000 58 18100 59 18000 60 19600 61 19000 62 19200 63 18000 64 17600...
My last question has gone hours without being answered, so I am submitting these again. Anyone wh...
 My last question has gone hours without being answered, so I
am submitting these again. Anyone who could help with these 10
questions would be MASSIVELY appreciated. Thank you!!
11. Find the y-intercept of the equation of the least-squares regression line for the dataset in the table. (1 poins x y 1 15 6 18 7 18 15 24 16 23 22 26 23 27 28 30 33 32 0.52 1.91 15.14 -23.91 12. For the data in the table,...
My last question has gone hours without being answered, so I
am submitting these again. Anyone who could help with these 10
questions would be MASSIVELY appreciated. Thank you!!
11. Find the y-intercept of the equation of the least-squares regression line for the dataset in the table. (1 poins x y 1 15 6 18 7 18 15 24 16 23 22 26 23 27 28 30 33 32 0.52 1.91 15.14 -23.91 12. For the data in the table,...
Please explain the steps that need to be taken in Excel in order to complete the questions.
 Please explain the steps that need to be taken in Excel in order
to complete the questions.
Wal-Mart Revenue: Case Study One Wal-Mart is the second largest retailer in the world. The data file (WalMart_revenue.xlsx) is included in the Excel data zip file in week one, and it holds monthly data on Wal-Mart's revenue, along with several possibly related economic variables. (a) Develop a linear regression model to predict Wal-Mart revenue, using CPI as the only (b) Develop a linear...
Please explain the steps that need to be taken in Excel in order
to complete the questions.
Wal-Mart Revenue: Case Study One Wal-Mart is the second largest retailer in the world. The data file (WalMart_revenue.xlsx) is included in the Excel data zip file in week one, and it holds monthly data on Wal-Mart's revenue, along with several possibly related economic variables. (a) Develop a linear regression model to predict Wal-Mart revenue, using CPI as the only (b) Develop a linear...
Could you teach me do this by Ti83or 84? Below is data collected over 6 specific years. The data collected is the Consumer Price Index (CPT) and the cost of a slice of pizza We would...
 Could you teach me do this by Ti83or 84?
Below is data collected over 6 specific years. The data collected is the Consumer Price Index (CPT) and the cost of a slice of pizza We would like to build a model using the CPI to predict the cost of a slice of pizza in a given year. Year 1960 1973 1986 1995 2002 2003 CPI (x) 30.2 48.3 112.3 162.2 191.9 197.8 Cost of a slice 0.15 0.35 1.00 1.25...
Could you teach me do this by Ti83or 84?
Below is data collected over 6 specific years. The data collected is the Consumer Price Index (CPT) and the cost of a slice of pizza We would like to build a model using the CPI to predict the cost of a slice of pizza in a given year. Year 1960 1973 1986 1995 2002 2003 CPI (x) 30.2 48.3 112.3 162.2 191.9 197.8 Cost of a slice 0.15 0.35 1.00 1.25...
 My last question has gone hours without being answered, so I
am submitting these again. Anyone who could help with these 10
questions would be MASSIVELY appreciated. Thank you!!
11. Find the y-intercept of the equation of the least-squares regression line for the dataset in the table. (1 poins x y 1 15 6 18 7 18 15 24 16 23 22 26 23 27 28 30 33 32 0.52 1.91 15.14 -23.91 12. For the data in the table,...
My last question has gone hours without being answered, so I
am submitting these again. Anyone who could help with these 10
questions would be MASSIVELY appreciated. Thank you!!
11. Find the y-intercept of the equation of the least-squares regression line for the dataset in the table. (1 poins x y 1 15 6 18 7 18 15 24 16 23 22 26 23 27 28 30 33 32 0.52 1.91 15.14 -23.91 12. For the data in the table,...
 Please explain the steps that need to be taken in Excel in order
to complete the questions.
Wal-Mart Revenue: Case Study One Wal-Mart is the second largest retailer in the world. The data file (WalMart_revenue.xlsx) is included in the Excel data zip file in week one, and it holds monthly data on Wal-Mart's revenue, along with several possibly related economic variables. (a) Develop a linear regression model to predict Wal-Mart revenue, using CPI as the only (b) Develop a linear...
Please explain the steps that need to be taken in Excel in order
to complete the questions.
Wal-Mart Revenue: Case Study One Wal-Mart is the second largest retailer in the world. The data file (WalMart_revenue.xlsx) is included in the Excel data zip file in week one, and it holds monthly data on Wal-Mart's revenue, along with several possibly related economic variables. (a) Develop a linear regression model to predict Wal-Mart revenue, using CPI as the only (b) Develop a linear...
 Could you teach me do this by Ti83or 84?
Below is data collected over 6 specific years. The data collected is the Consumer Price Index (CPT) and the cost of a slice of pizza We would like to build a model using the CPI to predict the cost of a slice of pizza in a given year. Year 1960 1973 1986 1995 2002 2003 CPI (x) 30.2 48.3 112.3 162.2 191.9 197.8 Cost of a slice 0.15 0.35 1.00 1.25...
Could you teach me do this by Ti83or 84?
Below is data collected over 6 specific years. The data collected is the Consumer Price Index (CPT) and the cost of a slice of pizza We would like to build a model using the CPI to predict the cost of a slice of pizza in a given year. Year 1960 1973 1986 1995 2002 2003 CPI (x) 30.2 48.3 112.3 162.2 191.9 197.8 Cost of a slice 0.15 0.35 1.00 1.25...
Most questions answered within 3 hours.
-
An unknown amount of a compound with a molecular mass of 284.04
g/mol is dissolved in...
asked 3 minutes ago -
You are at rest at a stop sign. There is another stop sign that
is 100...
asked 4 minutes ago -
Calculate the equilibrium electrode potential for Fe3+/Fe2+
redox system, if the initial concentration of Fe2+ is...
asked 7 minutes ago -
Describe in detail with graph and diagram how bonding force,
bonding curves and bonding energy at...
asked 24 minutes ago -
Gingerbread cookies become inedible if not eaten quickly enough.
Clarence is trying to determine how many...
asked 20 minutes ago -
A
crane lifts a 200 kg block a height of 10 m in 18 seconds. What...
asked 23 minutes ago -
A 12.0-g bullet is fired horizontally into a 115-g wooden block
that is initially at rest...
asked 23 minutes ago -
Which DNA primer would have the HIGHEST melting temperature?
Question 17 options:
a)
GCATCGGC
b)
AATCGGAT...
asked 31 minutes ago -
what is the charge on the chromium ion in Cr2O3.
a -3
b -2
c 0...
asked 31 minutes ago -
which of the following may lead to speciation?
a. a group of individuals from a mainland...
asked 36 minutes ago -
Please I need today answer for This question and it is very
important and I need...
asked 55 minutes ago -
Five years from today, you plan to invest $3,700 for 7
additional years at 5.8 percent...
asked 55 minutes ago