1.) A company is producing a product that has the following data: volume of sales per year = 3 00...
1.) A company is producing a product that has the following data:
volume of sales per year = 3
00,000 units
selling price per unit = $10
0
variable cost = $6
0 per unit
fixed costs per year = $6
00,000
book depreciation = $4
00,000
tax depreciation = $50
0,000
debt interest = $1
00,000
tax rate = 40%
With the above data determine
(a) Before
-
tax profit
(b) After
-
tax profit
(c) Break
-
even yea
rly volume of sales
(d) Break
-
even selling price
(e) Plot the break
-
even chart
Homework Answers
From the given data
Total sales revenue = selling price * total volume of shares
= 300,000*100
=30000,000 dollars
total cost of firm = variable cost + fixed cost
= variable price * total volume+ fixed cost
= 60* 300,000+600,000
= 18600,000 dollars
Earning before interest tax depreciation(EBITD) = sales - cost
= 30000,000-18600,000
= 11400,000 dollars
Earnings before interest and tax (EBIT)= EBITD - depreciation
=11400,000-(400,000+500,000)
=10500,000 dollars
Earnings before tax = EBIT - interest
= 10500,000-100,00,
=10400,000 dollars
BEFORE TAX PROFIT = 10400,000 DOLLARS
tax = 40 % = 0.4* 10400,000 = 4160,000 dollars
AFTER TAX PROFIT = 10400,000-4160,000 = 6240,000 DOLLARS
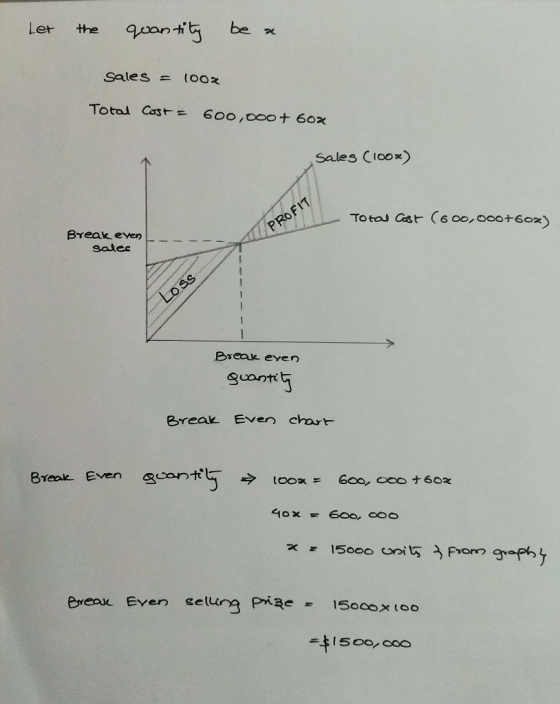
Break even yearly volume of sales
= ( fixed cost )/ ( selling price per unit - variable cost per unit)
= 600000/(100-60)
=600000/40 = 15000 units
Break even selling price = break even quantity * selling price per unit
=15000*100=1500,000 dollars
PLOT
Add Answer to:
1.) A company is producing a product that has the following data: volume of sales per year = 3 00...
eoconomy ENGR 3970 Homework Assignment #5 - Fall 2019, Due Mon Nov 4 Note: Show all of your work to arrive at a fina...
 eoconomy
ENGR 3970 Homework Assignment #5 - Fall 2019, Due Mon Nov 4 Note: Show all of your work to arrive at a final result. 1.) A company is producing a product that has the following data: volume of sales per year = 300,000 units selling price per unit = $100 variable cost-$60 per unit fixed costs per year = $600,000 book depreciation = $400,000 tax depreciation = $500,000 debt interest - $100,000 tax rate = 40% With the above...
eoconomy
ENGR 3970 Homework Assignment #5 - Fall 2019, Due Mon Nov 4 Note: Show all of your work to arrive at a final result. 1.) A company is producing a product that has the following data: volume of sales per year = 300,000 units selling price per unit = $100 variable cost-$60 per unit fixed costs per year = $600,000 book depreciation = $400,000 tax depreciation = $500,000 debt interest - $100,000 tax rate = 40% With the above...
Break-Even Sales and Cost-Volume-Profit Chart For the coming year, Cleves Company anticipates a unit selling price...
 Break-Even Sales and Cost-Volume-Profit Chart For the coming year, Cleves Company anticipates a unit selling price of $142, a unit variable cost of $71, and fixed costs of $418,900. Required: 1. Compute the anticipated break-even sales (units). units 2. Compute the sales (units) required to realize a target profit of $220,100. units 3. Construct a cost-volume-profit chart on paper assuming maximum sales of 11,800 units within the relevant range. From your chart, indicate whether each of the following sales levels...
Break-Even Sales and Cost-Volume-Profit Chart Last year, Hever Inc. had sales of $500,000, based on a...
Break-Even Sales and Cost-Volume-Profit Chart Last year, Hever Inc. had sales of $500,000, based on a unit selling price of $250. The variable costper unit was $175, and fixed costs were $75,000. The maximum sales within Hever Inc.'s relevant range are 2,500 units. Hever Inc. is considering a proposal to spend an additional $33,750 on billboard advertising during the current year in an attempt to increase sales and utilize unused capacity. Required: 1. Construct a cost-volume-profit chart on your own...
Break-Even Sales and Cost-Volume-Profit Chart For the coming year, Cleves Company anticipates a unit selling price...
 Break-Even Sales and Cost-Volume-Profit Chart For the coming year, Cleves Company anticipates a unit selling price of $94, a unit variable cost of $47, and fixed costs of $366,600. Required: 1. Compute the anticipated break-even sales in units. units 2. Compute the sales (units) required to realize income from operations of $183,300. units 3. Construct a cost-volume-profit chart, assuming maximum sales of 15,600 units within the relevant range. From your chart, indicate whether each of the following sales levels would...
Break-Even Sales and Cost-Volume-Profit Chart For the coming year, Sorkin Company anticipates a unit selling price...
 Break-Even Sales and Cost-Volume-Profit Chart For the coming year, Sorkin Company anticipates a unit selling price of $98, a unit variable cost of $49, and fixed costs of $396,900 Required: 1. Compute the anticipated break-even sales in units units 2. Compute the sales (units) required to realize income from operations of $196,000. units 3. Construct a cost-volume-profit chart, assuming maximum sales of 16,200 units within the relevant range. From your chart, indicate whether each of the following sales levels would...
Bauer Manufacturing Company reported the following data regarding a product it manufactures and sells. The sales...
Bauer Manufacturing Company reported the following data regarding a product it manufactures and sells. The sales price is $100. Variable costs Manufacturing $ 30 per unit Selling 12 per unit Fixed costs Manufacturing $ 360,000 per year Selling and administrative $ 162,000 per year Required Use the per-unit contribution margin approach to determine the break-even point in units and dollars. Use the per-unit contribution margin approach to determine the level of sales in units and dollars required to obtain a...
Break-Even Sales and Cost-Volume-Profit Graph For the coming year, Bernardino Company anticipates a unit selling price...
Break-Even Sales and Cost-Volume-Profit Graph For the coming year, Bernardino Company anticipates a unit selling price of $140, a unit variable cost of $70, and fixed costs of $735,000. Instructions: 1. Compute the anticipated break-even sales in units. _________________ units 2. Compute the sales (units) required to realize operating income of $322,000. _________________ units 3. Construct a cost-volume-profit graph on paper, assuming maximum sales of 21,000 units within the relevant range. From your chart, indicate whether each of the following...
Campbell Manufacturing Company reported the following data regarding a product it manufactures and sells. The sales...
 Campbell Manufacturing Company reported the following data regarding a product it manufactures and sells. The sales price is $42. $ 14 per unit 4 per unit Variable costs Manufacturing Selling Fixed costs Manufacturing Selling and administrative $169,000 per year $135,800 per year Required a. Use the per-unit contribution margin approach to determine the break-even point in units and dollars. b. Use the per-unit contribution margin approach to determine the level of sales in units and dollars required to obtain a...
Gibson Manufacturing Company reported the following data regarding a product it manufactures and sells. The sales...
 Gibson Manufacturing Company reported the following data regarding a product it manufactures and sells. The sales price is $44 Variable costs Manufacturing Selling 11 per unit 7 per unit Fixed costs Manufacturing Selling and administrative $160,000 per year $180,600 per year Required a. Use the per-unit contribution margin approach to determine the break-even point in units and dollars. b. Use the per-unit contribution margin approach to determine the level of sales in units and dollars required to obtain a profit...
Fanning Manufacturing Company reported the following data regarding a product it manufactures and sells. The sales...
 Fanning Manufacturing Company reported the following data regarding a product it manufactures and sells. The sales price is $46. $ 10 per unit 4 per unit Variable costs Manufacturing Selling Fixed costs Manufacturing Selling and administrative $164,000 per year $ 261,600 per year Required a. Use the per-unit contribution margin approach to determine the break-even point in units and dollars. b. Use the per-unit contribution margin approach to determine the level of sales in units and dollars required to obtain...
 eoconomy
ENGR 3970 Homework Assignment #5 - Fall 2019, Due Mon Nov 4 Note: Show all of your work to arrive at a final result. 1.) A company is producing a product that has the following data: volume of sales per year = 300,000 units selling price per unit = $100 variable cost-$60 per unit fixed costs per year = $600,000 book depreciation = $400,000 tax depreciation = $500,000 debt interest - $100,000 tax rate = 40% With the above...
eoconomy
ENGR 3970 Homework Assignment #5 - Fall 2019, Due Mon Nov 4 Note: Show all of your work to arrive at a final result. 1.) A company is producing a product that has the following data: volume of sales per year = 300,000 units selling price per unit = $100 variable cost-$60 per unit fixed costs per year = $600,000 book depreciation = $400,000 tax depreciation = $500,000 debt interest - $100,000 tax rate = 40% With the above...
 Break-Even Sales and Cost-Volume-Profit Chart For the coming year, Cleves Company anticipates a unit selling price of $142, a unit variable cost of $71, and fixed costs of $418,900. Required: 1. Compute the anticipated break-even sales (units). units 2. Compute the sales (units) required to realize a target profit of $220,100. units 3. Construct a cost-volume-profit chart on paper assuming maximum sales of 11,800 units within the relevant range. From your chart, indicate whether each of the following sales levels...
 Break-Even Sales and Cost-Volume-Profit Chart For the coming year, Cleves Company anticipates a unit selling price of $94, a unit variable cost of $47, and fixed costs of $366,600. Required: 1. Compute the anticipated break-even sales in units. units 2. Compute the sales (units) required to realize income from operations of $183,300. units 3. Construct a cost-volume-profit chart, assuming maximum sales of 15,600 units within the relevant range. From your chart, indicate whether each of the following sales levels would...
 Break-Even Sales and Cost-Volume-Profit Chart For the coming year, Sorkin Company anticipates a unit selling price of $98, a unit variable cost of $49, and fixed costs of $396,900 Required: 1. Compute the anticipated break-even sales in units units 2. Compute the sales (units) required to realize income from operations of $196,000. units 3. Construct a cost-volume-profit chart, assuming maximum sales of 16,200 units within the relevant range. From your chart, indicate whether each of the following sales levels would...
 Campbell Manufacturing Company reported the following data regarding a product it manufactures and sells. The sales price is $42. $ 14 per unit 4 per unit Variable costs Manufacturing Selling Fixed costs Manufacturing Selling and administrative $169,000 per year $135,800 per year Required a. Use the per-unit contribution margin approach to determine the break-even point in units and dollars. b. Use the per-unit contribution margin approach to determine the level of sales in units and dollars required to obtain a...
 Gibson Manufacturing Company reported the following data regarding a product it manufactures and sells. The sales price is $44 Variable costs Manufacturing Selling 11 per unit 7 per unit Fixed costs Manufacturing Selling and administrative $160,000 per year $180,600 per year Required a. Use the per-unit contribution margin approach to determine the break-even point in units and dollars. b. Use the per-unit contribution margin approach to determine the level of sales in units and dollars required to obtain a profit...
 Fanning Manufacturing Company reported the following data regarding a product it manufactures and sells. The sales price is $46. $ 10 per unit 4 per unit Variable costs Manufacturing Selling Fixed costs Manufacturing Selling and administrative $164,000 per year $ 261,600 per year Required a. Use the per-unit contribution margin approach to determine the break-even point in units and dollars. b. Use the per-unit contribution margin approach to determine the level of sales in units and dollars required to obtain...
Most questions answered within 3 hours.
-
Assume memory access is 10 units of time and disk access is
10000 units of time....
asked 3 minutes ago -
1. Are all good samples random?
2. Magazines often report surveys giving statistics such as “63%...
asked 24 minutes ago -
Under all the various types of market structures, firms
must eventually earn some economic profits for...
asked 11 minutes ago -
Consider the following fitness regime for a single locus trait
with two co-dominant alleles: w11 =...
asked 15 minutes ago -
A large cable company reports the following.
80% of its customers subscribe to its cable TV...
asked 31 minutes ago -
Please answer the question in brief.
Discuss the role of ERP in organizations. Are ERP tools...
asked 17 minutes ago -
Discuss the pros and cons of collaborative software such
as SameTime. Does it increase productivity? What...
asked 29 minutes ago -
Buying your in-laws a gift because it’s expected is
due to the ____________ motive of gift-giving....
asked 32 minutes ago -
Calculate the expected value, the variance, and the standard
deviation of the given random variable X....
asked 1 hour ago -
A hospital performs 100 surgeries per week. The probability that
complications after surgery occur is 10%....
asked 1 hour ago -
1 point) Given the significance level α=0.01 find the following:
(a) left-tailed z value z= (b)...
asked 1 hour ago -
Assuming you are the head of the software development unit at
Cyber.Soft, explain and justify why...
asked 39 minutes ago