Homework Answers
R-code for the problem is
library(ISLR)
library(randomForest)
library(rpart)
data=Carseats
smp_size <- floor(0.5 * nrow(data))
## set the seed to make your partition reproducible
set.seed(123)
train_ind <- sample(seq_len(nrow(data)), size = smp_size)
train <- data[train_ind, ]
test <- data[-train_ind, ]
#part b
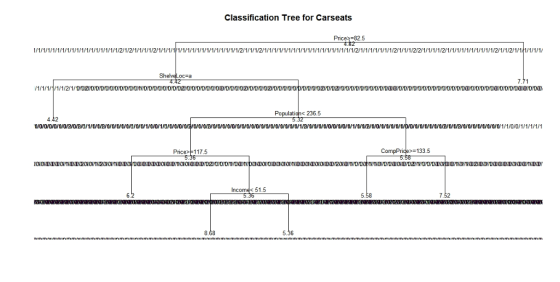
fit <- rpart(Sales~., method="class", data=train)
printcp(fit) # display the results
plotcp(fit) # visualize cross-validation results
summary(fit) # detailed summary of splits
plot(fit, uniform=TRUE,
main="Classification Tree for Carseats")
text(fit, use.n=T, all=T, cex=.8)
#part c
fit1=randomForest(Sales~.,data=train)
print(fit1)
importance(fit1)
#part d
fit2=randomForest(Sales~.,mtry=10,data=train)
importance(fit2)
fit3=randomForest(Sales~.,mtry=2,data=train)
importance(fit3)
#here no difference in changing importance by moving mtry
Add Answer to:
This is how you import the Carseats data into Rstudio software: library(“ISLR”) data(“Carseats”) ...
To import the Auto dataset into Rstudio: library("ISLR") data(Auto) view(Auto) Then, provide necessary codes for the...
To import the Auto dataset into Rstudio: library("ISLR") data(Auto) view(Auto) Then, provide necessary codes for the following: a. Create a binary variable FuelEfficient that takes on the value Yes or 1 if mpg is greater than 25 and takes on the value No or 0 if mpg is less than, or equal to, 25. b. Split the data into a training set and a test set. c. Fit a tree to the training data with FuelEfficient as the response variable....
(Referencing problem 6.1 from 'Data Mining for Business Analytics Concepts, Techniques, and Applications in R' Shmueli,...
(Referencing problem 6.1 from 'Data Mining for Business Analytics Concepts, Techniques, and Applications in R' Shmueli, et.al.) 6.1.d.iii. reads as follows: " Use stepwise regression with the three options (backward, forward, both) to reduce the remaining predictors as follows: Run stepwise on the training set. Choose the top from each stepwise run. Then use each of these models separately to predict the validation set. Compare RMSE, MAPE, and mean error, as well as lift charts. Finally, describe the best model."...
Using the RateMy Professor (Rateprof) dataset from alr4, we will explore the process of the stepw...
 Using the RateMy Professor (Rateprof) dataset from alr4, we will explore the process of the stepwise method quality is the response variable. gender, numYears, numRaters, numCourses, pepper, discipline, dept, helpfulness, clarity, easiness, raterInterest are the predictor variables. For simplicity, interactions are not considered. To understand the meaning of the variables, please use the code ?Rateprof after you import the library alr4. Consider quality ~1 to be the simplest model under consideration, and quality~ 1 + gender+ numYears+numRaters+ numCourse s +...
This problem uses the Wage dataset in ISLR package in R n this part of the...
This problem uses the Wage dataset in ISLR package in R n this part of the problem, we will find a polynomial function of age that best fits the wage data. For each polynomial function between p = 0, 1, 2, ...10: i. Fit a linear regression to predict wages as a function of age, age2, ... agep (you should include an intercept as well). Note that p = 0 model is an “intercept-only” model ii. Use 5-fold cross validation...
A statistical model is developed by training the machine learning algorithm using training data. In most...
A statistical model is developed by training the machine learning algorithm using training data. In most cases, this is just a subset of all the possible data for the problem for which the model is being developed. We want to develop a model that also works well with unseen data, called test data. The models that we build can overfit or underfit the data. With this in mind, which of the following statements is false: Using Ridge regression versus linear...
II 1. The Advertising data set consists of the sales (in thousands of units) of a...
 II 1. The Advertising data set consists of the sales (in thousands of units) of a particular product in 400 different markets. It also contains the advertising budgets (in thousands of dollars) for the product in each of the markets for three different media: TV, radio, and newspaper. The data set is divided in two parts-a training set consisting of 200 observations and a test set consisting of the remaining 200 observations. Three models are used on training data and...
A data set has 600 examples. To properly test the performance of the final hypothesis, you set as...
 if
coding is needed, please use python
A data set has 600 examples. To properly test the performance of the final hypothesis, you set aside a randomly selected subset of 200 examples which are never used in the training phase; these form a test set. You use a learning model with 1,000 hypotheses and select the final hypothesis g based on the 400 training examples. We wish to estimate Eout (g). We have access to two estimates: Ein(g), the in-sample...
if
coding is needed, please use python
A data set has 600 examples. To properly test the performance of the final hypothesis, you set aside a randomly selected subset of 200 examples which are never used in the training phase; these form a test set. You use a learning model with 1,000 hypotheses and select the final hypothesis g based on the 400 training examples. We wish to estimate Eout (g). We have access to two estimates: Ein(g), the in-sample...
Need help with stats true or false questions Decide (with short explanations) whether the following statements are true or false a) We consider the model y-Ao +A(z) +E. Let (-0.01, 1.5) be a 95% con...
 Need help with stats true or false questions
Decide (with short explanations) whether the following statements are true or false a) We consider the model y-Ao +A(z) +E. Let (-0.01, 1.5) be a 95% confidence interval for A In this case, a t-test with significance level 1% rejects the null hypothesis Ho : A-0 against a two sided alternative. b) Complicated models with a lot of parameters are better for prediction then simple models with just a few parameters c)...
Need help with stats true or false questions
Decide (with short explanations) whether the following statements are true or false a) We consider the model y-Ao +A(z) +E. Let (-0.01, 1.5) be a 95% confidence interval for A In this case, a t-test with significance level 1% rejects the null hypothesis Ho : A-0 against a two sided alternative. b) Complicated models with a lot of parameters are better for prediction then simple models with just a few parameters c)...
1. Choose a data set of your own:?Response or dependent variable (Y)?At least 3 or more...
1. Choose a data set of your own:?Response or dependent variable (Y)?At least 3 or more independent variables (X1, X2, X3, ... etc.) that you believe has an influence on Y.?At least 40 observations or data points?If there are categorical variables, model them appropriately2. Fit a multiple regression model. ?Interpret the model equation?Are all the chosen variables significant? Discuss.?Check for model assumptions and make appropriate comments.?How good is the model? Comment on R2 , R , se, F-value etc and...
Find some "real world" data. This data needs to have two sets of numbers that correspond...
 Find some "real world" data. This data needs to have two sets of numbers that correspond to each other in an exponential pattern. Choose data with at least 10 pairs of data values. Caution: Do not select specific problems already in your text! Also, please be careful not to select exponential growth models that do not need data fitting such as doubling models. For example, if you already know a particular model grows by doubling each time period, then you...
 Using the RateMy Professor (Rateprof) dataset from alr4, we will explore the process of the stepwise method quality is the response variable. gender, numYears, numRaters, numCourses, pepper, discipline, dept, helpfulness, clarity, easiness, raterInterest are the predictor variables. For simplicity, interactions are not considered. To understand the meaning of the variables, please use the code ?Rateprof after you import the library alr4. Consider quality ~1 to be the simplest model under consideration, and quality~ 1 + gender+ numYears+numRaters+ numCourse s +...
 II 1. The Advertising data set consists of the sales (in thousands of units) of a particular product in 400 different markets. It also contains the advertising budgets (in thousands of dollars) for the product in each of the markets for three different media: TV, radio, and newspaper. The data set is divided in two parts-a training set consisting of 200 observations and a test set consisting of the remaining 200 observations. Three models are used on training data and...
 if
coding is needed, please use python
A data set has 600 examples. To properly test the performance of the final hypothesis, you set aside a randomly selected subset of 200 examples which are never used in the training phase; these form a test set. You use a learning model with 1,000 hypotheses and select the final hypothesis g based on the 400 training examples. We wish to estimate Eout (g). We have access to two estimates: Ein(g), the in-sample...
if
coding is needed, please use python
A data set has 600 examples. To properly test the performance of the final hypothesis, you set aside a randomly selected subset of 200 examples which are never used in the training phase; these form a test set. You use a learning model with 1,000 hypotheses and select the final hypothesis g based on the 400 training examples. We wish to estimate Eout (g). We have access to two estimates: Ein(g), the in-sample...
 Need help with stats true or false questions
Decide (with short explanations) whether the following statements are true or false a) We consider the model y-Ao +A(z) +E. Let (-0.01, 1.5) be a 95% confidence interval for A In this case, a t-test with significance level 1% rejects the null hypothesis Ho : A-0 against a two sided alternative. b) Complicated models with a lot of parameters are better for prediction then simple models with just a few parameters c)...
Need help with stats true or false questions
Decide (with short explanations) whether the following statements are true or false a) We consider the model y-Ao +A(z) +E. Let (-0.01, 1.5) be a 95% confidence interval for A In this case, a t-test with significance level 1% rejects the null hypothesis Ho : A-0 against a two sided alternative. b) Complicated models with a lot of parameters are better for prediction then simple models with just a few parameters c)...
 Find some "real world" data. This data needs to have two sets of numbers that correspond to each other in an exponential pattern. Choose data with at least 10 pairs of data values. Caution: Do not select specific problems already in your text! Also, please be careful not to select exponential growth models that do not need data fitting such as doubling models. For example, if you already know a particular model grows by doubling each time period, then you...
Most questions answered within 3 hours.
-
How
would I know whether a given amino acid has an ionizable group or
not? please...
asked 5 minutes ago -
True or false?
True False The function of the enzyme acyl CoA
synthetase is the ATP-dependent coupling...
asked 5 minutes ago -
Nadia Corporation adjusts its debt so that its interest coverage
(EBIT/Interest) remains constant at 3. Nadia’s...
asked 7 minutes ago -
In a clinical trial, 20 out of 600 patients taking a
prescription drug complained of flulike...
asked 13 minutes ago -
7. How many types of nuclear processes can produce energy? 8.
How many types of radioactive...
asked 17 minutes ago -
For both the Sn2 and Sn1 reaction
conditions:
Structure | Rxn (Y/N) at room T° Rxn...
asked 17 minutes ago -
11. In cell N2, enter a formula using the IF function and a
structured reference to...
asked 17 minutes ago -
There is X-linked mutations in flies in this example. You need
to determine the inheritence pattern...
asked 19 minutes ago -
1) There is a 5.0 μC charge at each of 3 corners of a square
(each...
asked 30 minutes ago -
A study of 420,095 cell phone users found that
134 of them developed cancer of the...
asked 34 minutes ago -
2.50 g of NH4Cl is added to 12.9 g of water. Calculate the
molality of the...
asked 36 minutes ago -
Part 1
(a) Calculate the pH at 25°C of a 0.10 M solution of a
weak...
asked 38 minutes ago