Round to the fourth and write as a proportion unless otherwise stated. Problem 1 Scores on a stat...
Round to the fourth and write as a proportion unless otherwise stated.
Problem 1
Scores on a statistics final for a very large class
were normally distributed with a mean of 73 and a
standard deviation of 9. Draw a picture for each and
show calculator commands.
a. Find the probability a randomly selected student scored between
a 45 and 70.
b. Find the score that represents the top 5% of exam scores.
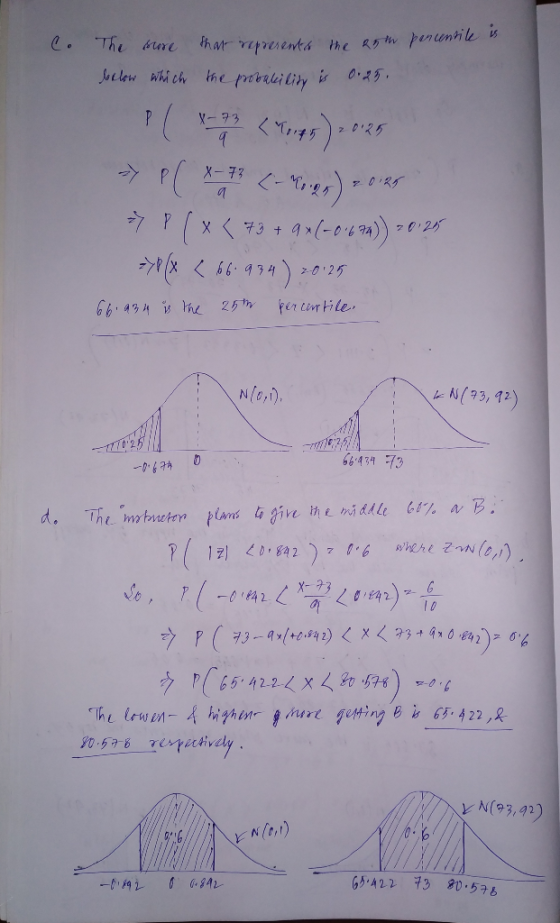
c. Find the score that represents the 25th percentile.
e. The instructor plans to give the middle 60% a B. Find the
lowest and highest score that will get a B.
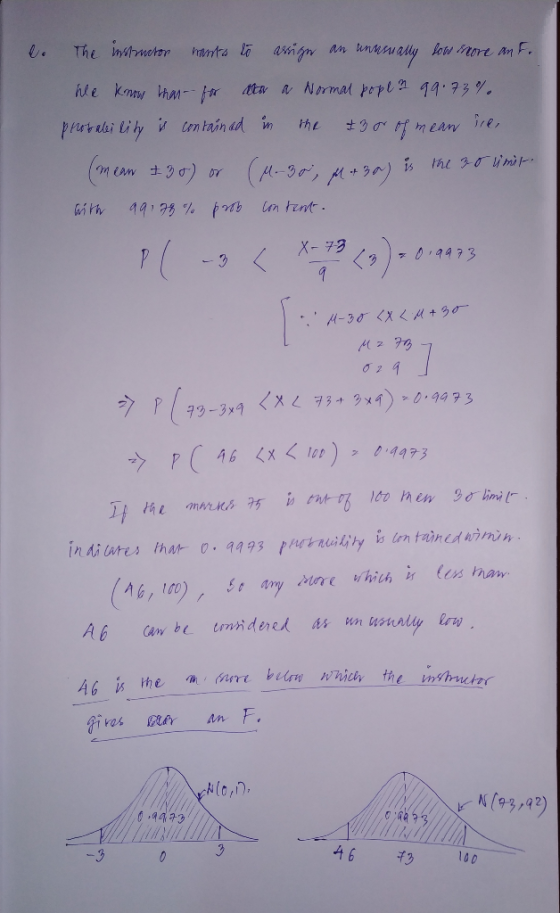
f. The instructor only wants to assign an unusually low score an F.
What score would be the cutoff for this? Explain.
Homework Answers

Add Answer to:
Round to the fourth and write as a proportion unless otherwise stated. Problem 1 Scores on a stat...
Exam grades: Scores on a statistics final in a large class were normally distributed with a...
 Exam grades: Scores on a statistics final in a large class were normally distributed with a mean of 71 and a standard deviation of 8. Use the T1-84 PLUS calculator to answer the following. Round the answers to at least two decimals. (a) Find the 47 percentile of the scores (b) Find the 65 percentile of the scores. (c) The instructor wants to give an A to the students whose scores were in the top 12% of the class. What...
Exam grades: Scores on a statistics final in a large class were normally distributed with a...
 Exam grades: Scores on a statistics final in a large class were normally distributed with a mean of 71 and a standard deviation of 8. Use the TI-84 PLUS calculator to answer the following. Round the answers to at least two decimals. ol. (a) Find the 47th percentile of the scores. (b) Find the 65th percentile of the scores. (c) The instructor wants to give an A to the students whose scores were in the top 12% of the class....
Exam grades: Scores on a statistics final in a large class were normally distributed with a...
 Exam grades: Scores on a statistics final in a large class were normally distributed with a mean of 78 and a standard deviation of 7. Use the TI-84 PLUS calculator to answer the following. Round the answers to at least two decimals. (a) Find the 34" percentile of the scores. (b) Find the 68th percentile of the scores. (C) The instructor wants to give an A to the students whose scores were in the top 11% of the class. What...
Question 9 of 13 (points) Attempt 1 of 1 | View question in a popup th...
 Question 9 of 13 (points) Attempt 1 of 1 | View question in a popup th 56m Remaining 72 Section Exercise 50 (table) Exam grades: Scores on a statistics final in a large class were normally distributed with a mean of 76 and a standard deviation of 9. Use the Cumulative Normal Distribution Table to answer the following. (a) Find the 25th percentile of the scores. (b) Find the 79th percentile of the scores, (c) The instructor wants to give...
Do not use MS Excel or statistics software unless stated otherwise (1 -2) (Confidence Interval) T...
 Do not use MS Excel or statistics software unless stated otherwise (1 -2) (Confidence Interval) The following sample data are measurements of weight of middle school students. 153,148, 151, 163, 114,164, 135, 131,176 (25%) Assume that we do not know the true standard deviation of middle school students Calculate the two-sided 95% confidence intervals on the mean (find both upper and lower limits). I. 2. (25%) Assume now that we know the standard deviation of all middle school students is...
Can I get the normal graph explanation to this question, NOT USING EXCEL. yto All DATE...
 Can I get the normal graph explanation to this question,
NOT USING EXCEL.
yto All DATE & TIME 1/17/20 Forward Recipients Mess PROBLEM 4 The grades on the midterm examination given in a large managerial statistics class are normally distributed with mean 75 and standard deviation 9. The instructor of this class u must use normal graphs from our notes to solve these problems. wants to assign an A grade to the top 10% of the scores, a B grade...
Can I get the normal graph explanation to this question,
NOT USING EXCEL.
yto All DATE & TIME 1/17/20 Forward Recipients Mess PROBLEM 4 The grades on the midterm examination given in a large managerial statistics class are normally distributed with mean 75 and standard deviation 9. The instructor of this class u must use normal graphs from our notes to solve these problems. wants to assign an A grade to the top 10% of the scores, a B grade...
4. Short answer questions. Unless stated otherwise, each part is unrelated In the linear regression model,...
 4. Short answer questions. Unless stated otherwise, each part is unrelated In the linear regression model, it was found that the 90% confidence interval for the regression coefficient ? is (1.5, 9.3). What can you say, if anything, about the p-value of test of hypotheses Ho: ß-0 vs.Ha, B 0? a. b. A two-sample t test is performed with Ha: ?1 > ?2 and a test statistic of t =-1.24 is observed. Draw a sketch of the area corresponding to...
The scores on a Statistics exam are normally distributed with a mean 75 with a standard...
The scores on a Statistics exam are normally distributed with a mean 75 with a standard deviation of 5. If nine students are randomly selected what is the probability that their mean score is greater than 68. (a) .0808 (b) -.4000 (c) .9192 (d) .0001 (e) .9999 29. Refer to question 28. Suppose that students with the lowest 10% of scores are placed on academic probation, what is the cutoff score to avoid being placed on academic probation? (a) >...
Please help me answer theses. Thank you on me stuaernts resuits neau trie steps Deiow ald...
 Please help me answer theses. Thank you
on me stuaernts resuits neau trie steps Deiow ald compiete each item. Suppose a professor gives an exam to a class of 40 students and the scores are as follows. (Open the Lab 7.2 data set in StatCrunch.) 1. 35 44 46 4747 48 49 51 53 54 55 55 57 57 57 58 59 5959 59 60 60 60 60 60 62 62 62 6468 69 7072 73 7375 75 77 82...
Please help me answer theses. Thank you
on me stuaernts resuits neau trie steps Deiow ald compiete each item. Suppose a professor gives an exam to a class of 40 students and the scores are as follows. (Open the Lab 7.2 data set in StatCrunch.) 1. 35 44 46 4747 48 49 51 53 54 55 55 57 57 57 58 59 5959 59 60 60 60 60 60 62 62 62 6468 69 7072 73 7375 75 77 82...
 Exam grades: Scores on a statistics final in a large class were normally distributed with a mean of 71 and a standard deviation of 8. Use the T1-84 PLUS calculator to answer the following. Round the answers to at least two decimals. (a) Find the 47 percentile of the scores (b) Find the 65 percentile of the scores. (c) The instructor wants to give an A to the students whose scores were in the top 12% of the class. What...
 Exam grades: Scores on a statistics final in a large class were normally distributed with a mean of 71 and a standard deviation of 8. Use the TI-84 PLUS calculator to answer the following. Round the answers to at least two decimals. ol. (a) Find the 47th percentile of the scores. (b) Find the 65th percentile of the scores. (c) The instructor wants to give an A to the students whose scores were in the top 12% of the class....
 Exam grades: Scores on a statistics final in a large class were normally distributed with a mean of 78 and a standard deviation of 7. Use the TI-84 PLUS calculator to answer the following. Round the answers to at least two decimals. (a) Find the 34" percentile of the scores. (b) Find the 68th percentile of the scores. (C) The instructor wants to give an A to the students whose scores were in the top 11% of the class. What...
 Question 9 of 13 (points) Attempt 1 of 1 | View question in a popup th 56m Remaining 72 Section Exercise 50 (table) Exam grades: Scores on a statistics final in a large class were normally distributed with a mean of 76 and a standard deviation of 9. Use the Cumulative Normal Distribution Table to answer the following. (a) Find the 25th percentile of the scores. (b) Find the 79th percentile of the scores, (c) The instructor wants to give...
 Do not use MS Excel or statistics software unless stated otherwise (1 -2) (Confidence Interval) The following sample data are measurements of weight of middle school students. 153,148, 151, 163, 114,164, 135, 131,176 (25%) Assume that we do not know the true standard deviation of middle school students Calculate the two-sided 95% confidence intervals on the mean (find both upper and lower limits). I. 2. (25%) Assume now that we know the standard deviation of all middle school students is...
 Do not use MS Excel or statistics software unless stated otherwise (1 -2) (Confidence Interval) The following sample data are measurements of weight of middle school students. 153,148, 151, 163, 114,164, 135, 131,176 (25%) Assume that we do not know the true standard deviation of middle school students Calculate the two-sided 95% confidence intervals on the mean (find both upper and lower limits). I. 2. (25%) Assume now that we know the standard deviation of all middle school students is...
 Can I get the normal graph explanation to this question,
NOT USING EXCEL.
yto All DATE & TIME 1/17/20 Forward Recipients Mess PROBLEM 4 The grades on the midterm examination given in a large managerial statistics class are normally distributed with mean 75 and standard deviation 9. The instructor of this class u must use normal graphs from our notes to solve these problems. wants to assign an A grade to the top 10% of the scores, a B grade...
Can I get the normal graph explanation to this question,
NOT USING EXCEL.
yto All DATE & TIME 1/17/20 Forward Recipients Mess PROBLEM 4 The grades on the midterm examination given in a large managerial statistics class are normally distributed with mean 75 and standard deviation 9. The instructor of this class u must use normal graphs from our notes to solve these problems. wants to assign an A grade to the top 10% of the scores, a B grade...
 4. Short answer questions. Unless stated otherwise, each part is unrelated In the linear regression model, it was found that the 90% confidence interval for the regression coefficient ? is (1.5, 9.3). What can you say, if anything, about the p-value of test of hypotheses Ho: ß-0 vs.Ha, B 0? a. b. A two-sample t test is performed with Ha: ?1 > ?2 and a test statistic of t =-1.24 is observed. Draw a sketch of the area corresponding to...
 Please help me answer theses. Thank you
on me stuaernts resuits neau trie steps Deiow ald compiete each item. Suppose a professor gives an exam to a class of 40 students and the scores are as follows. (Open the Lab 7.2 data set in StatCrunch.) 1. 35 44 46 4747 48 49 51 53 54 55 55 57 57 57 58 59 5959 59 60 60 60 60 60 62 62 62 6468 69 7072 73 7375 75 77 82...
Please help me answer theses. Thank you
on me stuaernts resuits neau trie steps Deiow ald compiete each item. Suppose a professor gives an exam to a class of 40 students and the scores are as follows. (Open the Lab 7.2 data set in StatCrunch.) 1. 35 44 46 4747 48 49 51 53 54 55 55 57 57 57 58 59 5959 59 60 60 60 60 60 62 62 62 6468 69 7072 73 7375 75 77 82...
Most questions answered within 3 hours.
-
A construction company is planning to bid on a building
contract. The bid costs the company...
asked 8 minutes ago -
A sample of 45 observations is selected from a normal
population. The sample mean is 49,...
asked 11 minutes ago -
A firm operating in a purely competitive environment is faced
with a market price of $250....
asked 15 minutes ago -
•Let’s say someone claims the average population size is
600 feet squared and the housing authority...
asked 22 minutes ago -
Cynaide is a deadly poison that blocks the last step in the
electron transport chain of...
asked 27 minutes ago -
Your friend tells you that there is a vending machine on campus
that dispenses M&M packs...
asked 42 minutes ago -
What advantages are there to using piperidine rather than
hydroxide as a base?
asked 40 minutes ago -
7. The life of a Freeze Breeze electric fan is normally
distributed with a mean 4...
asked 43 minutes ago -
1. A 751 mL NaCl solution is diluted to a volume of 1.06 L and a...
asked 48 minutes ago -
8
A $20,000 face value STRIPS is currently quoted at 38.642 and
has 8 years to...
asked 49 minutes ago -
The current exchange rate between the Japanese yen and
the US dollar is 120 yen per...
asked 50 minutes ago -
Marla’s Massages and More bought a special massage table two
years ago for $9,300. At the...
asked 58 minutes ago