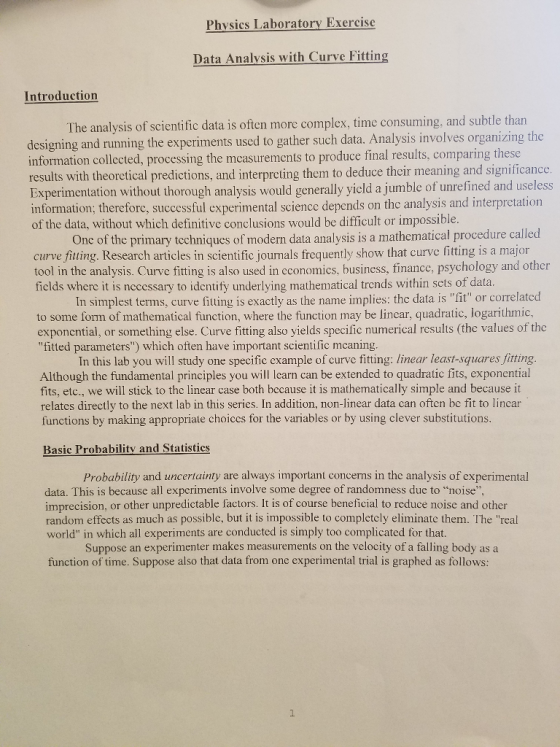
Physics Laboratory Exercise Data Analysis with Curve Fitting Introduction The analysis of scientific data is often more complex, time consuming, and subtle than designing and running the experiments used to gather such data. Analysis involves organizing the information collected, processing the measurements to produce final results, comparing these results with theoretical predictions, and interpreting them to deduce their meaning and signilicance Experimentation without thorough analysis would generally yield a jumble of unrefined and usele information; thereforc, successful experimental science depends on the analysis and interprctatio of the data, without which definitive conclusions would be difficult or impossible One of the primary techniques of modern data analysis is a mathematical procedure called curve fitting. Research articles in scientific jounals frequently show that curve fitting is a major tool in the analysis. Curve fitting is also used in economics, business, finance, psychology and other ficlds where it is ncccssary to identify underlying mathematical trends within sets of data or correlated In simplest terms, curve fiting is exactly as the name implies: the data is "fit" to some form of mathematical function, where the function may be lincar, quadratic, logarithmic. exponcntial, or something else. Curve fitting also yields specific numerical results (the values of the "fitted parameters") which often have important scientific mcaning In this lab you will study one specific example of curve fitting: linear least-squares fitting Although the fundamental principles you will lcarn can be extended to quadratic fits, exponential fits, etc., we will stick to the linear case both because it is mathematically simple and because it relates directly to the next lab in this series. In addition, non-linear data can often be fit to lincar functions by making appropriate choices for the variables or by using clever substitutions. Basic Probability and Statistics Probability and uncertainty are always important concerns in the analysis of experimental data. This is because all experiments involve some degree of randomness due to "noise recision, or other unpredictable factors. It is of course beneficial to reduce noise and other imp random effects as much as possible, but it is impossible to completely eliminate them. The "'real rld" in which all experiments are conducted is simply too complicated for that Suppose an experimenter makes measurements on the velocity of a falling body as a function of time. Suppose also that data from one experimental trial is graphed as follows
Homework Answers

Add Answer to:
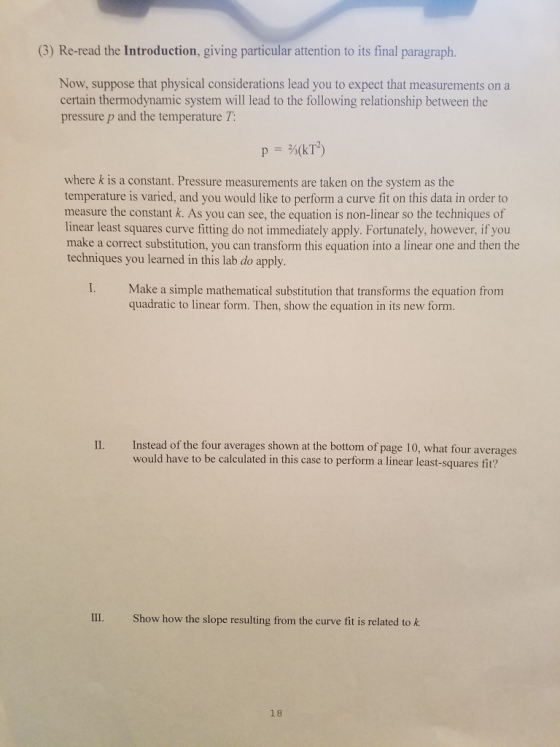
(3) Re-read the Introduction, giving particular attention to its final paragraph. Now, suppose th...
A wind tunnel test conducted on an airfoil section yielded the following data between the lift...
 A wind tunnel test conducted on an airfoil section yielded the following data between the lift coefficient (CL) and the angle of attack (?): 12 1.40 16 1.71 20 1.38 de CL 0.11 0.55 0.95 You are required to develop a suitable polynomial relationship between ? and CL and fit a curve to the data points by the least-squares method using (a) hand calculations and (b) Matlab programming Hint: A quadratic equation (parabola) y(x)-aa,x +a x' can be used in...
Hello, i need help in question 3 and 4 please.. It's for physical chem lab ....
 Hello, i need help in question 3 and 4 please.. It's for physical
chem lab .
Thanks in advance!
easoning Which form of magnesium is most appropriate for measuring the property identified in question 5? Pre-Experiment Questions Part Two Physical chemistry is a quantitative science in which data is modeled. The model is often (but not always) a known equation based on a definition or concept. Modeling is accomplished by graphing the data and fitting the equation using least squares...
Hello, i need help in question 3 and 4 please.. It's for physical
chem lab .
Thanks in advance!
easoning Which form of magnesium is most appropriate for measuring the property identified in question 5? Pre-Experiment Questions Part Two Physical chemistry is a quantitative science in which data is modeled. The model is often (but not always) a known equation based on a definition or concept. Modeling is accomplished by graphing the data and fitting the equation using least squares...
Based on this data, I find it hard to the calculations and analysis and discussion Beer's...
 Based on this data, I find it hard to the calculations and analysis
and discussion
Beer's Law Calculations: A. Dilution Calculations 1. Use the actual mass of cobalt(II) nitrate hexahydrate you used to calculate the concentration of your stock solution. 2. Calculate the concentration of your diluted solutions. The easiest way to do this is with the equation MiV2-M2V2. Show the work for the calculation of the concentration of at least one of your dilute solutions. 3. Make a table...
Based on this data, I find it hard to the calculations and analysis
and discussion
Beer's Law Calculations: A. Dilution Calculations 1. Use the actual mass of cobalt(II) nitrate hexahydrate you used to calculate the concentration of your stock solution. 2. Calculate the concentration of your diluted solutions. The easiest way to do this is with the equation MiV2-M2V2. Show the work for the calculation of the concentration of at least one of your dilute solutions. 3. Make a table...
please help with no 3,4,5 and 6 Thanks 1. What is standard error? Measure of statistical...
 please help with no 3,4,5 and 6
Thanks
1. What is standard error? Measure of statistical accuracy of an estimate, equal to the standard deviation of the theorental distribution of a large populanon of such estimates 2. What calculation is used to describe the variation in measurements. 3. In experiment 3.2. You will be measuring out 40ml of volume. How many times will you measure 40 ml? 4. What is the difference for each time you measure out 40ml? In...
please help with no 3,4,5 and 6
Thanks
1. What is standard error? Measure of statistical accuracy of an estimate, equal to the standard deviation of the theorental distribution of a large populanon of such estimates 2. What calculation is used to describe the variation in measurements. 3. In experiment 3.2. You will be measuring out 40ml of volume. How many times will you measure 40 ml? 4. What is the difference for each time you measure out 40ml? In...
Project Number 9 Statistical analysis of radiation data recorded by an ionization chamber Project Number 9...
 Project Number 9 Statistical analysis of radiation data recorded by an ionization chamber Project Number 9 Statistical analysis of radiation data recorded by an ionization chamber In this project, you are required to statistically analyze the data of radiation dose recorded by an ionization chamber experimentally in the research lab. Background of the problem: For measuring the radiation dose delivered to a body by a given radiation beam, an ionization chamber (detector) is used. An ionization chamber is made up...
A group of physics students collected data from a test of the projectile motion problem that...
 A group of physics students collected data from a test of the projectile motion problem that was analyzed in a previous lab exercise (L5). In their test, the students varied the angle and initial velocity Vo at which the projectile was launched, and then measured the resulting time of flight (tright). Note that tright was the dependent variable, while and Vo were independent variables. The results are listed below. (degrees) Time of Flight (s) Initial Velocity V. (m/s) 15 20...
will work with up to 3 partners (similar to a lab group) to prepare a written report which analyzes kinetic data that has been provided to you. All student groups will receive data for the hy...
 will work with up to 3 partners (similar to a lab group) to prepare a written report which analyzes kinetic data that has been provided to you. All student groups will receive data for the hypothetical reaction aAlE) products where a is a numeric variable and A is a chemical variable. The reaction therefore has the form of a decomposition reaction, in which a single substance forms one or more new substances. For consistency, all concentrations start out at 1.000...
 A wind tunnel test conducted on an airfoil section yielded the following data between the lift coefficient (CL) and the angle of attack (?): 12 1.40 16 1.71 20 1.38 de CL 0.11 0.55 0.95 You are required to develop a suitable polynomial relationship between ? and CL and fit a curve to the data points by the least-squares method using (a) hand calculations and (b) Matlab programming Hint: A quadratic equation (parabola) y(x)-aa,x +a x' can be used in...
 Hello, i need help in question 3 and 4 please.. It's for physical
chem lab .
Thanks in advance!
easoning Which form of magnesium is most appropriate for measuring the property identified in question 5? Pre-Experiment Questions Part Two Physical chemistry is a quantitative science in which data is modeled. The model is often (but not always) a known equation based on a definition or concept. Modeling is accomplished by graphing the data and fitting the equation using least squares...
Hello, i need help in question 3 and 4 please.. It's for physical
chem lab .
Thanks in advance!
easoning Which form of magnesium is most appropriate for measuring the property identified in question 5? Pre-Experiment Questions Part Two Physical chemistry is a quantitative science in which data is modeled. The model is often (but not always) a known equation based on a definition or concept. Modeling is accomplished by graphing the data and fitting the equation using least squares...
 Based on this data, I find it hard to the calculations and analysis
and discussion
Beer's Law Calculations: A. Dilution Calculations 1. Use the actual mass of cobalt(II) nitrate hexahydrate you used to calculate the concentration of your stock solution. 2. Calculate the concentration of your diluted solutions. The easiest way to do this is with the equation MiV2-M2V2. Show the work for the calculation of the concentration of at least one of your dilute solutions. 3. Make a table...
Based on this data, I find it hard to the calculations and analysis
and discussion
Beer's Law Calculations: A. Dilution Calculations 1. Use the actual mass of cobalt(II) nitrate hexahydrate you used to calculate the concentration of your stock solution. 2. Calculate the concentration of your diluted solutions. The easiest way to do this is with the equation MiV2-M2V2. Show the work for the calculation of the concentration of at least one of your dilute solutions. 3. Make a table...
 please help with no 3,4,5 and 6
Thanks
1. What is standard error? Measure of statistical accuracy of an estimate, equal to the standard deviation of the theorental distribution of a large populanon of such estimates 2. What calculation is used to describe the variation in measurements. 3. In experiment 3.2. You will be measuring out 40ml of volume. How many times will you measure 40 ml? 4. What is the difference for each time you measure out 40ml? In...
please help with no 3,4,5 and 6
Thanks
1. What is standard error? Measure of statistical accuracy of an estimate, equal to the standard deviation of the theorental distribution of a large populanon of such estimates 2. What calculation is used to describe the variation in measurements. 3. In experiment 3.2. You will be measuring out 40ml of volume. How many times will you measure 40 ml? 4. What is the difference for each time you measure out 40ml? In...
 Project Number 9 Statistical analysis of radiation data recorded by an ionization chamber Project Number 9 Statistical analysis of radiation data recorded by an ionization chamber In this project, you are required to statistically analyze the data of radiation dose recorded by an ionization chamber experimentally in the research lab. Background of the problem: For measuring the radiation dose delivered to a body by a given radiation beam, an ionization chamber (detector) is used. An ionization chamber is made up...
 A group of physics students collected data from a test of the projectile motion problem that was analyzed in a previous lab exercise (L5). In their test, the students varied the angle and initial velocity Vo at which the projectile was launched, and then measured the resulting time of flight (tright). Note that tright was the dependent variable, while and Vo were independent variables. The results are listed below. (degrees) Time of Flight (s) Initial Velocity V. (m/s) 15 20...
 will work with up to 3 partners (similar to a lab group) to prepare a written report which analyzes kinetic data that has been provided to you. All student groups will receive data for the hypothetical reaction aAlE) products where a is a numeric variable and A is a chemical variable. The reaction therefore has the form of a decomposition reaction, in which a single substance forms one or more new substances. For consistency, all concentrations start out at 1.000...
Most questions answered within 3 hours.
-
Although Epicurus advocates pursuing pleasure for the
good life, discuss a few reasons why he does...
asked 1 minute ago -
Problem 1: Present entries to record the selected transactions
described below:
(a)
Issued $2,790,000 of 5-year,...
asked 8 minutes ago -
Using technology to support HR activities increases:
a.
the efficiency of the administrative HR functions.
b....
asked 8 minutes ago -
1. List the features used to classify leaf
types.
2. List some characteristics that are shared...
asked 13 minutes ago -
The three elements of Value Proposition, Key Customers, and
Capabilities operate within an environment. Which of...
asked 16 minutes ago -
Katelynn, a physician, earns $200,000 from her medical practice
in the current year. She receives $45,000...
asked 23 minutes ago -
Each row of the table below describes an aqueous solution at
25°C
.
The second column...
asked 28 minutes ago -
A horizontal wire is at y = 0. Current travels in the +x
direction. The magnetic...
asked 28 minutes ago -
Let X be a continuous random variable whose PDF is Let X be a
continuous random...
asked 49 minutes ago -
Martinez Company’s relevant range of production is 7,500 units
to 12,500 units. When it produces and...
asked 47 minutes ago -
A football with a mass of 1.2 kg is kicked from ground level to
a height...
asked 53 minutes ago -
Remember: Changes in supply determinants shift supply, and
changes in demand determinants shift demand. We say...
asked 52 minutes ago