
Homework Answers

Code:
clc;clear all;close all;
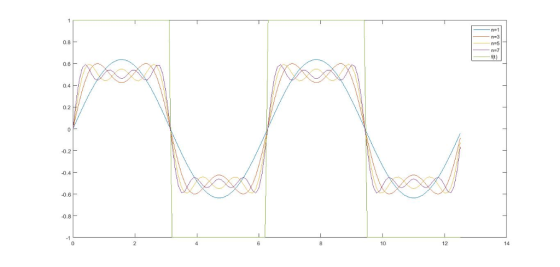
t=0:0.1:4*pi;
y1=sin(t)*(2/pi);
y3=sin(t)*(2/pi)+sin(3*t)*(2/(3*pi));
y5=sin(t)*(2/pi)+sin(3*t)*(2/(3*pi))+sin(5*t)*(2/(5*pi));
y7=sin(t)*(2/pi)+sin(3*t)*(2/(3*pi))+sin(5*t)*(2/(5*pi))+sin(7*t)*(2/(7*pi));
plot(t,y1,t,y3,t,y5,t,y7),hold on;
x=square(t);
%plot(x,t),hold off;
plot(t,x),hold off;
plot(t,y1,t,y3,t,y5,t,y7,t,x)
%grid on
legend('n=1','n=3','n=5','n=7','f(t)')
MATLAB FOUIRER SERIES REPRESENTATION:
Add Answer to:
EXAMPLE 4.2 Fourier series of a square wave Consider the square wave of Figure 4.4. This signal i...
13-9 Find the first five nonzero Fourier coefficients of the shifted and offset square wave in...
 13-9 Find the first five nonzero Fourier coefficients of the shifted and offset square wave in Figure P13-9. Use your results to write an expression in the corresponding Fourier series v(t) (V) 0 5- t(ms) 0.25 1.25 2.25 10 FIGURE P13-9
Use MATLAB to solve this question: Lab Exercises: Fourier Series Coefficients 4 In this lab, the...
 Use MATLAB to solve this question: Lab Exercises: Fourier Series Coefficients 4 In this lab, the objective is to create a set of functions that will enable us to do the following 1. Evaluate the Fourier Series coefficients for the following periodic signal which is defined over one period to be rt)240sin (100nt) for 0ts 1/100 (6) The period is 1/100 seconds. This signal is called a full-wave rectified sinusoid, because it contains only the positive lobe of the sinusoidal...
Determine the Fourier series for the rectangular wave illustrated in Figure P3.28, and plot the resultsHint:The...
 Determine the Fourier series
for the rectangular wave illustrated in Figure P3.28, and plot the
resultsHint:The square wave of period Tis described by
3.27 Determine the Fourier series for the rectangular wave illustrated in Figure P3.28, and plot the results 2T Эт Hint: The square wave of period T is described by
Determine the Fourier series
for the rectangular wave illustrated in Figure P3.28, and plot the
resultsHint:The square wave of period Tis described by
3.27 Determine the Fourier series for the rectangular wave illustrated in Figure P3.28, and plot the results 2T Эт Hint: The square wave of period T is described by
2. Increase the period of square signal in (b) with keeping same pulse duration, as shown...
 2. Increase the period of square signal in (b) with keeping same pulse duration, as shown in the following figure То (c) A -A Ti Find the Fourier series coefficients az, as well as M7 and 8. for (c) T1=(1/4)To. Sketch the spectrum for both cases. Consider what spectrum will be if T1/To → 0. Procedures: Use the Signal Generator to generate the above signals according to the setting listed in Table I and measure the spectral from the Digital...
HW 11.5 Consider the periodic "square wave" signal defined by x(t)- u(t - 4k) - u(t - 2-4k) (a) S...
 HW 11.5 Consider the periodic "square wave" signal defined by x(t)- u(t - 4k) - u(t - 2-4k) (a) Sketch x(t) (b) Sketch g(t) = x(t)-0.5 (c) Sketch |x(jw)|. Hint: First determine the Fourier series expansion of x() (d) Sketch IG(Go)
HW 11.5 Consider the periodic "square wave" signal defined by x(t)- u(t - 4k) - u(t - 2-4k) (a) Sketch x(t) (b) Sketch g(t) = x(t)-0.5 (c) Sketch |x(jw)|. Hint: First determine the Fourier series expansion of x() (d)...
HW 11.5 Consider the periodic "square wave" signal defined by x(t)- u(t - 4k) - u(t - 2-4k) (a) Sketch x(t) (b) Sketch g(t) = x(t)-0.5 (c) Sketch |x(jw)|. Hint: First determine the Fourier series expansion of x() (d) Sketch IG(Go)
HW 11.5 Consider the periodic "square wave" signal defined by x(t)- u(t - 4k) - u(t - 2-4k) (a) Sketch x(t) (b) Sketch g(t) = x(t)-0.5 (c) Sketch |x(jw)|. Hint: First determine the Fourier series expansion of x() (d)...
Can someone explain each part of this solution I don’t understand Example 1 square wave Derive...
 Can someone explain each part of this solution I don’t
understand
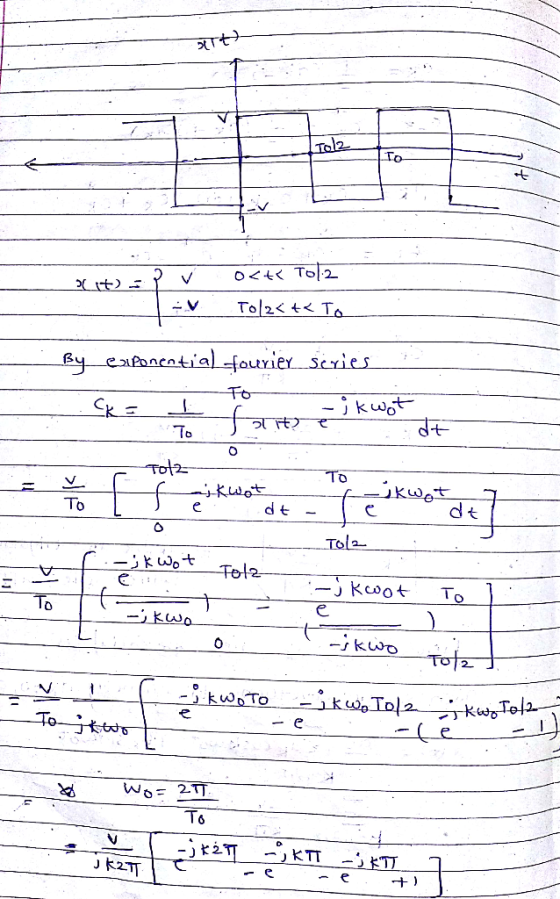
Example 1 square wave Derive the Fourier series (FS) representation of a square wave of period T with duty cycle τ-AT, where 0< B<1. The square wave is symmetrically defined over one period by a Heaviside unit-step function, as in Eq. (28) It! <汁 (77) The ordinary unit-step could also be used, but the Heaviside is more natural here because the FS representation will pass through the 1/2 point...
Can someone explain each part of this solution I don’t
understand
Example 1 square wave Derive the Fourier series (FS) representation of a square wave of period T with duty cycle τ-AT, where 0< B<1. The square wave is symmetrically defined over one period by a Heaviside unit-step function, as in Eq. (28) It! <汁 (77) The ordinary unit-step could also be used, but the Heaviside is more natural here because the FS representation will pass through the 1/2 point...
Consider a square wave f(x) of length 2L over the range?0,2 L1 as shown in Figure...
 Consider a square wave f(x) of length 2L over the range?0,2 L1 as shown in Figure l. Formally f(x) can be written as where H(x) is the Heaviside step function Since f(x) (2L x), the function is odd, such that aoan0 Find the Fourier series expansion bin] of the square wave given in Figure 1 and plot the summation of the first 7 (odd) terms of the series from n1 to n 13. Please provide the MATLAB code and plot...
1. Using Fourier series expansion, it can be shown that a square wave, x(0), with frequency, fo. can be decomposed into...
 1. Using Fourier series expansion, it can be shown that a square wave, x(0), with frequency, fo. can be decomposed into sinusoids using the following formula x(t)-(4/n) Ση: 1,3,5, (1/n) sinCanAO where n is the harmonic number. In this lab, you will approximate the square wave using only the first two harmonics, n-1, 3. The square wave will be approximated by Rt R2 L074 RO Rt Figure I: Non-inverting Summing Amplifier 2. Consider the circuit of a non-inverting summing amplifier...
1. Using the Fourier series analysis Equation 3 for the periodic function r(t) shown in Figure 2....
 1. Using the Fourier series analysis Equation 3 for the periodic function r(t) shown in Figure 2.1, determine both the DC coefficient ao and a general expression for the other Fourier series coefficients ak. Do this by hand, not in Matlab. Show all your work in your lab report. You can add these pages as hand-written pages, rather than typing them in to your lab report, if you prefer Hint 1: It will be easiest to integrate this function from...
Please do Part 4 and Show all work! 1. 145 points) <FM/FSK Modulation/Demodulations A periodic wave m(t) in Figure 1 below The resulting FM signal is demodulated as shown in the following figure b...
 Please do Part 4 and Show all work!
1. 145 points) <FM/FSK Modulation/Demodulations A periodic wave m(t) in Figure 1 below The resulting FM signal is demodulated as shown in the following figure by using frequency discriminator. Assume no attenuation of the signal due to propagation loss (in other words assume amplifiers properly restored the amplitude of the transmitted signal at the receiver) [10 points] Find the Fourier Series (trigonometric Fourier Series) of the message signal m (t) where To...
Please do Part 4 and Show all work!
1. 145 points) <FM/FSK Modulation/Demodulations A periodic wave m(t) in Figure 1 below The resulting FM signal is demodulated as shown in the following figure by using frequency discriminator. Assume no attenuation of the signal due to propagation loss (in other words assume amplifiers properly restored the amplitude of the transmitted signal at the receiver) [10 points] Find the Fourier Series (trigonometric Fourier Series) of the message signal m (t) where To...
 13-9 Find the first five nonzero Fourier coefficients of the shifted and offset square wave in Figure P13-9. Use your results to write an expression in the corresponding Fourier series v(t) (V) 0 5- t(ms) 0.25 1.25 2.25 10 FIGURE P13-9
 Use MATLAB to solve this question: Lab Exercises: Fourier Series Coefficients 4 In this lab, the objective is to create a set of functions that will enable us to do the following 1. Evaluate the Fourier Series coefficients for the following periodic signal which is defined over one period to be rt)240sin (100nt) for 0ts 1/100 (6) The period is 1/100 seconds. This signal is called a full-wave rectified sinusoid, because it contains only the positive lobe of the sinusoidal...
 Determine the Fourier series
for the rectangular wave illustrated in Figure P3.28, and plot the
resultsHint:The square wave of period Tis described by
3.27 Determine the Fourier series for the rectangular wave illustrated in Figure P3.28, and plot the results 2T Эт Hint: The square wave of period T is described by
Determine the Fourier series
for the rectangular wave illustrated in Figure P3.28, and plot the
resultsHint:The square wave of period Tis described by
3.27 Determine the Fourier series for the rectangular wave illustrated in Figure P3.28, and plot the results 2T Эт Hint: The square wave of period T is described by
 2. Increase the period of square signal in (b) with keeping same pulse duration, as shown in the following figure То (c) A -A Ti Find the Fourier series coefficients az, as well as M7 and 8. for (c) T1=(1/4)To. Sketch the spectrum for both cases. Consider what spectrum will be if T1/To → 0. Procedures: Use the Signal Generator to generate the above signals according to the setting listed in Table I and measure the spectral from the Digital...
 HW 11.5 Consider the periodic "square wave" signal defined by x(t)- u(t - 4k) - u(t - 2-4k) (a) Sketch x(t) (b) Sketch g(t) = x(t)-0.5 (c) Sketch |x(jw)|. Hint: First determine the Fourier series expansion of x() (d) Sketch IG(Go)
HW 11.5 Consider the periodic "square wave" signal defined by x(t)- u(t - 4k) - u(t - 2-4k) (a) Sketch x(t) (b) Sketch g(t) = x(t)-0.5 (c) Sketch |x(jw)|. Hint: First determine the Fourier series expansion of x() (d)...
HW 11.5 Consider the periodic "square wave" signal defined by x(t)- u(t - 4k) - u(t - 2-4k) (a) Sketch x(t) (b) Sketch g(t) = x(t)-0.5 (c) Sketch |x(jw)|. Hint: First determine the Fourier series expansion of x() (d) Sketch IG(Go)
HW 11.5 Consider the periodic "square wave" signal defined by x(t)- u(t - 4k) - u(t - 2-4k) (a) Sketch x(t) (b) Sketch g(t) = x(t)-0.5 (c) Sketch |x(jw)|. Hint: First determine the Fourier series expansion of x() (d)...
 Can someone explain each part of this solution I don’t
understand
Example 1 square wave Derive the Fourier series (FS) representation of a square wave of period T with duty cycle τ-AT, where 0< B<1. The square wave is symmetrically defined over one period by a Heaviside unit-step function, as in Eq. (28) It! <汁 (77) The ordinary unit-step could also be used, but the Heaviside is more natural here because the FS representation will pass through the 1/2 point...
Can someone explain each part of this solution I don’t
understand
Example 1 square wave Derive the Fourier series (FS) representation of a square wave of period T with duty cycle τ-AT, where 0< B<1. The square wave is symmetrically defined over one period by a Heaviside unit-step function, as in Eq. (28) It! <汁 (77) The ordinary unit-step could also be used, but the Heaviside is more natural here because the FS representation will pass through the 1/2 point...
 Consider a square wave f(x) of length 2L over the range?0,2 L1 as shown in Figure l. Formally f(x) can be written as where H(x) is the Heaviside step function Since f(x) (2L x), the function is odd, such that aoan0 Find the Fourier series expansion bin] of the square wave given in Figure 1 and plot the summation of the first 7 (odd) terms of the series from n1 to n 13. Please provide the MATLAB code and plot...
 1. Using Fourier series expansion, it can be shown that a square wave, x(0), with frequency, fo. can be decomposed into sinusoids using the following formula x(t)-(4/n) Ση: 1,3,5, (1/n) sinCanAO where n is the harmonic number. In this lab, you will approximate the square wave using only the first two harmonics, n-1, 3. The square wave will be approximated by Rt R2 L074 RO Rt Figure I: Non-inverting Summing Amplifier 2. Consider the circuit of a non-inverting summing amplifier...
 1. Using the Fourier series analysis Equation 3 for the periodic function r(t) shown in Figure 2.1, determine both the DC coefficient ao and a general expression for the other Fourier series coefficients ak. Do this by hand, not in Matlab. Show all your work in your lab report. You can add these pages as hand-written pages, rather than typing them in to your lab report, if you prefer Hint 1: It will be easiest to integrate this function from...
 Please do Part 4 and Show all work!
1. 145 points) <FM/FSK Modulation/Demodulations A periodic wave m(t) in Figure 1 below The resulting FM signal is demodulated as shown in the following figure by using frequency discriminator. Assume no attenuation of the signal due to propagation loss (in other words assume amplifiers properly restored the amplitude of the transmitted signal at the receiver) [10 points] Find the Fourier Series (trigonometric Fourier Series) of the message signal m (t) where To...
Please do Part 4 and Show all work!
1. 145 points) <FM/FSK Modulation/Demodulations A periodic wave m(t) in Figure 1 below The resulting FM signal is demodulated as shown in the following figure by using frequency discriminator. Assume no attenuation of the signal due to propagation loss (in other words assume amplifiers properly restored the amplitude of the transmitted signal at the receiver) [10 points] Find the Fourier Series (trigonometric Fourier Series) of the message signal m (t) where To...
Most questions answered within 3 hours.
-
One member in the comp set that did not have supply, demand, and
revenue data. What...
asked 1 minute ago -
1. Methods of collecting data - Experiments and direct
observation
In each of the following situations,...
asked 6 minutes ago -
What is the density of a substance that takes up 3.4e3 cubic cm
and weighs 1.96...
asked 16 minutes ago -
Consider a single wire loop of radius a. Calculate the magnetic
field B(z) along the axis...
asked 12 minutes ago -
For each of the compounds listed below you must draw the Lewis
dot structure in the...
asked 15 minutes ago -
1. Hypothesize in what type of environments it would be
advantageous for a protist to be...
asked 14 minutes ago -
Each protein is composed of a maximum of ____________ different
amino acids in varying numbers and...
asked 23 minutes ago -
The mayor of a town has proposed a plan for the construction of
a new community....
asked 33 minutes ago -
2. KopyKat is a firm that specializes in printing business cards
using the latest laser technology....
asked 52 minutes ago -
What type of stock pays dividends in arrears?
A.
Nonminus−cumulative
preferred stock
B.
Cumulative preferred stock...
asked 51 minutes ago -
Discuss what issues you see as needing to be addressed in an
organization in order to...
asked 52 minutes ago -
Why does varying input frequency to a buck converter affect the
magnitude of the output voltage...
asked 55 minutes ago