
Demand-pull inflation results in ▼ price level, real GDP and ▼ employment.
Homework Answers
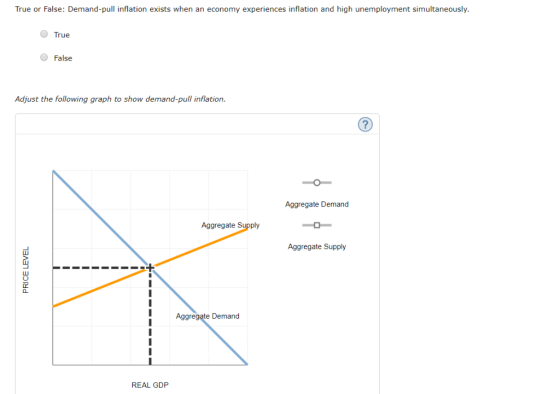
(1) False
High unemployment and high inflation are characteristics of cost-push inflation, which is caused by leftward shift of AS curve which raises price level but lowers real GDP.
(2) Demand pull inflation is represented by a rightward shift in AD curve, which increases both price level and real GDP.

(3) Demand pull inflation leads to higher price level, higher real GDP and lower unemployment.
Add Answer to:
True or False: Demand-pull inflation exists when an economy experiences inflation and high unempl...
The graph below depicts an economy where an increase in aggregate demand has caused inflation. The...
 The graph below depicts an economy where an increase in aggregate demand has caused inflation. The economy's current level of real GDP (Y) is above its long-run equilibrium. This is illustrated by the long-run aggregate supply curve (LRAS) and a price level 2) above the equilibrium value of Pe Fiscal Policy Price Level Real GDP Which of the following is an example of an automatic stabilizer that would help this economy move toward full employment again A reduced need for...
The graph below depicts an economy where an increase in aggregate demand has caused inflation. The...
 The graph below depicts an economy where an increase in aggregate demand has caused inflation. The economy's current level of real GDP (Y2) is above its long-run equilibrium. This is illustrated by the long-run aggregate supply curve (LRAS) and a price level (P2) above the equilibrium value of Pe Fiscal Policy LRAS AS AD. 1 Real GDP Which of the following is an example of an automatic stabilizer that would help this economy move toward fll employment again? A reduction...
The full employment output level is the maximum amount of output that the economy can produce...
The full employment output level is the maximum amount of output that the economy can produce when all its resources are fully employed, or its potential output level. The intersection of AD = AS and the vertical line are the same. This intersection of all three curves is the potential real GDP and the natural rate of unemployment. True False An inflationary gap exists when the macro economy is in equilibrium at more than the potential output of the economy...
The graph below depicts an economy where an increase in aggregate demand has caused Inflation. The...
 The graph below depicts an economy where an increase in aggregate demand has caused Inflation. The economy's current level of real GDP (Y2) is above Its long-run equilibrium, which is illustrated by the long-run aggregate supply curve (LRAS), and a price level (P2) above the equilibrium value of Pe. Without any fiscal policy, we expect the economy to eventually return to full employment on its own. Use the graph below to illustrate this process. Instructions: Use the tool provided to...
Illustrate and briefly explain the beginning of a demand-pull inflation. 3. When answering parts a and b,...
Illustrate and briefly explain the beginning of a demand-pull inflation. 3. When answering parts a and b, draw the relevant Phillips curve. Using a short-run Phillips curve, what is the effect on the unemployment rate if the inflation rate unexpectedly rises. Using a long-run Phillips curve, what is the effect on the unemployment rate if the inflation rate rises and people expect the rise. Explain how your answer to part a about the unexpected rise in the inflation rate changes in...
When the money demand curve shifts right and the money supply is unchanged, the equilibrium price...
When the money demand curve shifts right and the money supply is unchanged, the equilibrium price level decreases and the equilibrium value of money increases. true false The money supply in Grayfield is $8 billion. Nominal GDP is $32 billion and real GDP is $24 billion. The central bank of Grayfield has instituted a policy of zero inflation. Assuming that velocity is stable, if real GDP grows by 2.5 percent this year then the central bank of Grayfield will increase...
Suppose that workers and firms perfectly forecast inflation, so that the real wage remains unchanged as...
 Suppose that workers and firms perfectly forecast inflation, so that the real wage remains unchanged as the price level rises over time. Prices and wages rise at the same rate, which implies that the real wage stays constant. The following graph shows the aggregate demand curve (AD) in an economy in long-run equilibrium. Assume the natural rate of unemployment is 6%, and potential output is $50 trillion. Use the orange points (square symbol) to draw the aggregate supply curve in...
Define demand-pull inflation. Using the AS/AD model, explain how demand-pull inflation affects the level of aggregate...
 Define demand-pull inflation. Using the AS/AD model, explain how demand-pull inflation affects the level of aggregate output and the price level in the economy (which curve shifts, in what direction, and what happens to equilibrium output and price level). Give an example of macroeconomic policy that can be used to counter the effects of demand-pull inflation and discuss its effect on the equilibrium output and price level.
The following table shows the initial level of aggregate demand (AD) and te supply (AS) for the economy of Adanac.
 The following table shows the initial level of aggregate demand (AD) and te supply (AS) for the economy of Adanac. The full-employment level of output is $500 billion. a. Draw the corresponding initial aggregate demand and aggregate supply curve (AD0 and AS0). b. What is the initial equilibrium price level and level of real GDP? c. At this initial equilibrium (AD0 and AS0), is Adanac experiencing either a recessionary or inflationary gap? If so, how large a gap exists? d. Suppose the aggregate demand in...
Which of the following can cause demand-pull inflation if the economy is currently in equilibrium at full-employment GDP?
Which of the following can cause demand-pull inflation if the economy is currently in equilibrium at full-employment GDP? An increase in the labour participation rate A reduction in government spending A decrease in real wages An increase in net exports An increase in the company income tax rate.
 The graph below depicts an economy where an increase in aggregate demand has caused inflation. The economy's current level of real GDP (Y) is above its long-run equilibrium. This is illustrated by the long-run aggregate supply curve (LRAS) and a price level 2) above the equilibrium value of Pe Fiscal Policy Price Level Real GDP Which of the following is an example of an automatic stabilizer that would help this economy move toward full employment again A reduced need for...
 The graph below depicts an economy where an increase in aggregate demand has caused inflation. The economy's current level of real GDP (Y2) is above its long-run equilibrium. This is illustrated by the long-run aggregate supply curve (LRAS) and a price level (P2) above the equilibrium value of Pe Fiscal Policy LRAS AS AD. 1 Real GDP Which of the following is an example of an automatic stabilizer that would help this economy move toward fll employment again? A reduction...
 The graph below depicts an economy where an increase in aggregate demand has caused Inflation. The economy's current level of real GDP (Y2) is above Its long-run equilibrium, which is illustrated by the long-run aggregate supply curve (LRAS), and a price level (P2) above the equilibrium value of Pe. Without any fiscal policy, we expect the economy to eventually return to full employment on its own. Use the graph below to illustrate this process. Instructions: Use the tool provided to...
 Suppose that workers and firms perfectly forecast inflation, so that the real wage remains unchanged as the price level rises over time. Prices and wages rise at the same rate, which implies that the real wage stays constant. The following graph shows the aggregate demand curve (AD) in an economy in long-run equilibrium. Assume the natural rate of unemployment is 6%, and potential output is $50 trillion. Use the orange points (square symbol) to draw the aggregate supply curve in...
 Define demand-pull inflation. Using the AS/AD model, explain how demand-pull inflation affects the level of aggregate output and the price level in the economy (which curve shifts, in what direction, and what happens to equilibrium output and price level). Give an example of macroeconomic policy that can be used to counter the effects of demand-pull inflation and discuss its effect on the equilibrium output and price level.
Most questions answered within 3 hours.
-
Consider a transformer with 125 turns of wire in the primary
winding and 1475 turns of...
asked 1 minute from now -
Let h be the depth below the surface of the ocean at which the
absolute pressure...
asked 8 seconds ago -
Apply the four-stage New Product Development model shown in page
325 of your text book
(Concept...
asked 8 minutes ago -
An enzyme catalyzes the reaction A ⇌ B. The enzyme is present at
a concentration of...
asked 16 minutes ago -
The number of years of education of self-employed individuals in
the United States has a population...
asked 44 minutes ago -
Using the TI-84 calculator, find the area under the standard
normal curve that lies outside the...
asked 31 minutes ago -
You are considering the purchase of a share of Edie's common
stock. You expect to sell...
asked 33 minutes ago -
Assembly Programming
INCLUDE Irvine32.inc
Make a program that takes a string and a word as inputs...
asked 41 minutes ago -
Can I get a C++ code and output for this program using classes
instead of using...
asked 46 minutes ago -
A 4.0 L flask containing chlorine gas is connected to an
evacuated 3.0 L flask. If...
asked 57 minutes ago -
Write an essay containing your thoughts on
whether corporations should be limited in the amount of...
asked 58 minutes ago -
Given the following two sequences x (n)=[3 , 11,7 ,0 ,−1, 4 ,2
],−3≤n≤ 3 ;...
asked 57 minutes ago