
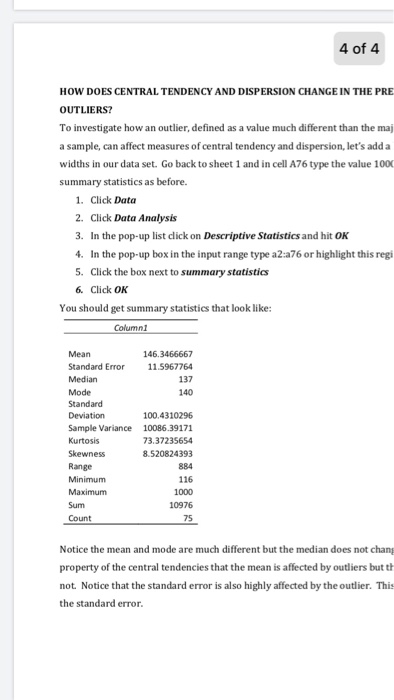

4 of 4 HOW DOES CENTRAL TENDENCY AND DISPERSION CHANGE IN THE PRE OUTLIERS? To investigate how an outlier, defined as a value much different than the maj a sample, can affect measures of central tendency and dispersion, let's add a widths in our data set. Go back to sheet 1 and in cell A76 type the value 100 summary statistics as before. 1. Click Data 2. Click Data Analysis 3. In the pop-up list click on Descriptive Statistics and hit OK 4. In the pop-up box in the input range type a2:a76 or highlight this regi 5. Click the box next to summary statistics 6. Click OK You should get summary statistics that look like: Mean Standard Ero115 Median Mode 146.3466667 11.5967764 137 140 100,4310296 Sample Variance 10086.39171 73.37235654 8.520824393 884 116 1000 10976 75 Range Sum Notice the mean and mode are much different but the median does not chang property of the central tendencies that the mean is affected by outliers but th not Notice that the standard error is also highly affected by the outlier. This the standard error
Summary of Descriptive Statistics Excel will tabulate a summary of the descriptive statistics for central tendency and using the Data Analysis Pack. Click Data Click Data Analysis .In the pop-up list click on Descriptive Statistics and hit OK . In the pop-up box in the input range type A2:A75 or highlight this region . Click the box next to summary statistics Click OK A box of summary statistics will appear like the one below Mean Standard Error Median Mode Standard Deviation Sample Variance Kurtosis Skewness Range Minimum Maximum Sum Count 134.8108 1.203271 136.5 129 10.35093 107.1418 1.00612 0.043921 41 116 157 9976 74 HOW DOES CENTRAL TENDENCY AND DISPERSION CHANGE IN THE PRESENC OUTLIERS?
Homework Answers
Answer
We know that mean and mode are dependent on entire data set and the median is only dependent on the middle value of the data. So, in case of outlier, only mean and mode will change and median will remain same.
In this case, mean and mode are increased due to the presence of outlier and median is same (just a 0.5 point variation due to the total number of data values which is changed from 74 to 75)
Dispersion or standard error is measures the difference between the each individual value and mean value. It is clear that the mean is changed, so there will be an increase in the dispersion or standard error because the sum of squared deviation is increased due to increase in mean.
Therefore, mean, mode and dispersion will increase in presence of outlier, but median will remain same.
Add Answer to:
Summary of Descriptive Statistics Excel will tabulate a summary of the descriptive statistics for...
Summary and Descriptive Statistics
There is often the requirement to evaluate descriptive statistics for data within the organization or for health care information. Every year the National Cancer Institute collects and publishes data based on patient demographics. Understanding differences between the groups based upon the collected data often informs health care professionals towards research, treatment options, or patient education.Using the data on the "National Cancer Institute Data" Excel spreadsheet, calculate the descriptive statistics indicated below for each of the Race/Ethnicity groups. Refer to your...
Mafer Dominguer EXLET Onicemsed PTOOIct le Home Insert Page Layout Formulas Data Review View Help Tell me what you...
 Mafer Dominguer EXLET Onicemsed PTOOIct le Home Insert Page Layout Formulas Data Review View Help Tell me what you want to do G K L M N Egrollment 26,106 Part 2: Using the Data Analysis Tool Using Descriptive (Length 3.26) Statistics to find measures of central tendency and dispersion Video #20 18,864 1,718 44,354 h. GO to the Data tab, use the Data Analysis tool, select Descriptive Statistice and place the results table to the right in column N. Do...
Total Blood Cholesterol Levels 160 160 170 150 160 170 155 350 180 155 180 160...
Total Blood Cholesterol Levels 160 160 170 150 160 170 155 350 180 155 180 160 150 180 150 180 23. Using the descriptive statistics analysis for ‘Total Blood Cholesterol Levels’ created for the 16 patients, how does the mean value compare to the median value and the mode value? a. These three measures of central tendency are similar. b. The mean is higher than the median and the mode. c. The mean is the preferable value to report for...
Thanks HE RESEARCHER H3 MEASURES OF CENTRAL TENDENCY 85 The Typical American Is there such a...
 Thanks
HE RESEARCHER H3 MEASURES OF CENTRAL TENDENCY 85 The Typical American Is there such a thing as a "typical" American? In this of the average American based on measures of central tendency chosen by you from the 2012 General Social Survey (GS$2012. Choose variables that you think are the most important in defining what it means to be a member of this soch ety and then choose an appropriate measure of central tendency for each variable. Use this information...
Thanks
HE RESEARCHER H3 MEASURES OF CENTRAL TENDENCY 85 The Typical American Is there such a thing as a "typical" American? In this of the average American based on measures of central tendency chosen by you from the 2012 General Social Survey (GS$2012. Choose variables that you think are the most important in defining what it means to be a member of this soch ety and then choose an appropriate measure of central tendency for each variable. Use this information...
Descriptive Statistics: The Old-Fashioned Way (and with 2. In this problem, calculate the descriptive statistics below...
 Descriptive Statistics: The Old-Fashioned Way (and with 2. In this problem, calculate the descriptive statistics below "by hand." That is, please show all of your calculations using Equation Editor (in Word, use Insert/Equation) or similar (although you must use R to verify your results). - Consider the hourly wages from a sample of six employed students duringa semester: w (10, 10, 16, 18, 18,18) A. Compute the arithmetic mean, geometric mean, median, and mode by B. Compute the variance, standard...
Date:06/15/2020 Introduction: Use the same scenario you submitted for the first assignment with modifications using your...
 Date:06/15/2020 Introduction: Use the same scenario you submitted for the first assignment with modifications using your instructor's feedback, if needed. Include Table 1: Variables Selected for the Analysis you used in Assignment #1 to show the variables you selected for analysis Table 1. Variables Selected for the Analysis Variable Name in data Description set Type of Variable (Qualitative or Quantitative) Variable 1: "Income" Quantitative Annual household income in USD Variable 2: Variable 3: Variable 4 Variable 5 Data Set Description...
The table below displays descriptive statistics for the variable "number of hours spent watching TV" for...
 The table below displays descriptive statistics for the variable "number of hours spent watching TV" for two groups of people (people who are very happy and people who are not too happy) from the General Social Survey. Use it to answer questions 50-53 below. Respondents who are very happy" Respondents who are not too happy 2.05 3.56 Mean Median Mode Std Deviation Mini Max Mean Vacan Mode Std. Deviation Minimum Maximum 30 21 Question 50 1 pts Compare/contrast "very happy...
- A variable is a. Unit upon which measurements are made b. Data collection form c....
- A variable is a. Unit upon which measurements are made b. Data collection form c. The characteristic being measured d. The realized measurement - For what kind of data are bar graphs best suited? a. Nominal or Ordinal b. Ordinal or Interval c. Nominal or Interval d. Interval or Ratio - Histograms display frequencies for what level of measurement? a. Ordinal b. Interval or Ratio c. Categorical d. Nominal - The term for a value that best describes the...
1.The two branches of statistics are (1.1) a) dependent and independent c) descriptive and inferential 2.When...
 1.The two branches of statistics are (1.1) a) dependent and independent c) descriptive and inferential 2.When we compute averages and standard deviations or graph data, we are b) population and sample d) ull and alternative workinq within a)descriptive statistics c) hypothesis testing 3. Which of the following groups is likely to have a lower standard deviation? b)inferential statistics d) statistical graphing (3.2) Group A: average heights of 13-year-old males Group B: average heights of 25-year old males a) Group A...
 Mafer Dominguer EXLET Onicemsed PTOOIct le Home Insert Page Layout Formulas Data Review View Help Tell me what you want to do G K L M N Egrollment 26,106 Part 2: Using the Data Analysis Tool Using Descriptive (Length 3.26) Statistics to find measures of central tendency and dispersion Video #20 18,864 1,718 44,354 h. GO to the Data tab, use the Data Analysis tool, select Descriptive Statistice and place the results table to the right in column N. Do...
 Thanks
HE RESEARCHER H3 MEASURES OF CENTRAL TENDENCY 85 The Typical American Is there such a thing as a "typical" American? In this of the average American based on measures of central tendency chosen by you from the 2012 General Social Survey (GS$2012. Choose variables that you think are the most important in defining what it means to be a member of this soch ety and then choose an appropriate measure of central tendency for each variable. Use this information...
Thanks
HE RESEARCHER H3 MEASURES OF CENTRAL TENDENCY 85 The Typical American Is there such a thing as a "typical" American? In this of the average American based on measures of central tendency chosen by you from the 2012 General Social Survey (GS$2012. Choose variables that you think are the most important in defining what it means to be a member of this soch ety and then choose an appropriate measure of central tendency for each variable. Use this information...
 Descriptive Statistics: The Old-Fashioned Way (and with 2. In this problem, calculate the descriptive statistics below "by hand." That is, please show all of your calculations using Equation Editor (in Word, use Insert/Equation) or similar (although you must use R to verify your results). - Consider the hourly wages from a sample of six employed students duringa semester: w (10, 10, 16, 18, 18,18) A. Compute the arithmetic mean, geometric mean, median, and mode by B. Compute the variance, standard...
 Date:06/15/2020 Introduction: Use the same scenario you submitted for the first assignment with modifications using your instructor's feedback, if needed. Include Table 1: Variables Selected for the Analysis you used in Assignment #1 to show the variables you selected for analysis Table 1. Variables Selected for the Analysis Variable Name in data Description set Type of Variable (Qualitative or Quantitative) Variable 1: "Income" Quantitative Annual household income in USD Variable 2: Variable 3: Variable 4 Variable 5 Data Set Description...
 The table below displays descriptive statistics for the variable "number of hours spent watching TV" for two groups of people (people who are very happy and people who are not too happy) from the General Social Survey. Use it to answer questions 50-53 below. Respondents who are very happy" Respondents who are not too happy 2.05 3.56 Mean Median Mode Std Deviation Mini Max Mean Vacan Mode Std. Deviation Minimum Maximum 30 21 Question 50 1 pts Compare/contrast "very happy...
 1.The two branches of statistics are (1.1) a) dependent and independent c) descriptive and inferential 2.When we compute averages and standard deviations or graph data, we are b) population and sample d) ull and alternative workinq within a)descriptive statistics c) hypothesis testing 3. Which of the following groups is likely to have a lower standard deviation? b)inferential statistics d) statistical graphing (3.2) Group A: average heights of 13-year-old males Group B: average heights of 25-year old males a) Group A...
Most questions answered within 3 hours.
-
A boy of mass 60 kg and a girl of mass 40 kg are together and...
asked 12 seconds from now -
Which of the following best describes transferred-in costs?
A) they are the cost of transferring products...
asked 9 minutes ago -
Programming in C:
Write a program that accepts an integer and two floating-point
values (All three...
asked 12 minutes ago -
In hypothesis testing, it is easier to reject H0 with
a ______________
directional test (one tail)...
asked 28 minutes ago -
Requirements:
For this exercise you are to implement a small bioinformatics
library for operations with DNA...
asked 19 minutes ago -
The stockholders’ equity section of Concord Corporation’s
balance sheet at December 31 is presented here.
CONCORD...
asked 22 minutes ago -
many biochemical dissolve in the aqueous media of the cell. What
does this imply about the...
asked 30 minutes ago -
Explain how to uphold conditions relating to the work environment,
equipment, materials, procedures and special requirements
asked 28 minutes ago -
The probability of a manufacturing defect in an aluminum
beverage can is .00008 if 100,600 cans...
asked 32 minutes ago -
Which aqueous solution below is most acidic?
a. pH= 3.00
c. [-OH]= 2 x 10^-3
b....
asked 54 minutes ago -
There are four (4) major financial statements: Income Statement,
Retained Earning (Owner's Equity) Statement, Balance Sheet,...
asked 1 hour ago -
A) Banana, Inc. has a book value per share of $8.70, earnings
per share of $1.68,...
asked 1 hour ago