

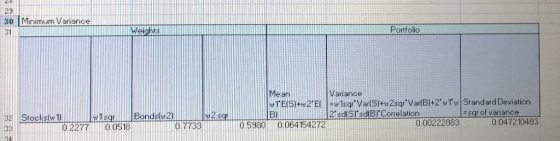
a. Calculate the average rate of return and standard deviation of the "Excess returns" after a continuous compounding transformation was performed. (Round your answers to 2 decimal places.) Weights in Stocks Bonds Portfolio Mean Standard deviation 0.0 0.1 0.9 0.2 0.8 0.3 0.7 0.4 0.5 0.5 0.6 0.4 0.7 0.3 0.8 0.2 0.9 0.1 0.6 1.0 d. What was the average return and standard deviation of the minimum-variance combination of stocks and bonds? (Round your answers to 2 decimal places.) Weights in Portfolio Stocks Bonds Mean Standard deviation Minimum-Variance 0.2277 0.7723
Homework Answers

Add Answer to:
The following table contains the historic returns from large stocks and long-term Treasury bonds ...
B13. (Excel: Portfolio returns and stand 996 a standard deviation of 10%, and HMT has an...
 B13. (Excel: Portfolio returns and stand 996 a standard deviation of 10%, and HMT has an expected return of 12% and a standard ation of 20%. The portfolio return and risk, of course, depend on the portfolio weight ard deviations) ARC has an expected return of dev,. rtfolio returns and stan- the correlation between ARC and HMT returns. Calculate the portfolio returns and ad dard deviations for the weights and correlations shown in the table PORTFOLIO STANDARD DEVIATION WEIGHTS FOR...
Annual and Average Returns for Stocks, Bonds, and T-Bills, 1950 to 2017 Long-Term Treasury Bonds 6.6%...
 Annual and Average Returns for Stocks, Bonds, and T-Bills, 1950 to 2017 Long-Term Treasury Bonds 6.6% 0.0 1.6 1950 to 2017 Average 1950 to 1959 Average 1960 to 1969 Average 1970 to 1979 Average 1980 to 1989 Average 1990 to 1999 Average 2000 to 2009 Average Annual Return 2011 Annual Return 2012 Annual Return 2013 Annual Return 2014 Annual Return 2015 Annual Return 2016 Annual Return 2017 Annual Return 2010 to 2017 Average Stocks 12.7% 20.9 8.7 7.5 18.2 19.0...
Annual and Average Returns for Stocks, Bonds, and T-Bills, 1950 to 2015 Long-Term Treasury B onds...
 Annual and Average Returns for Stocks, Bonds, and T-Bills, 1950 to 2015 Long-Term Treasury B onds 6.6% .0 1.6 5.7 13.5 Stocks 12.6% 9 28. 8.7 7.5 18.2 19.0 0.9 15.1 2.1 16. 32.4 13.7 1.4 1950 to 2015 Average 1950 to 1959 Average 1960 to 1969 Average 1970 to 1979 Average 1980 to 1989 Average 1990 to 1999 Average 2009 to 2009 Average 2010 Annual Return 2011 Annual Return 2012 Annual Return al Return 2013 Annual Return 2014 Annual...
Use the following table of returns from 1926 through 2017: Series Large stocks Small stocks Long-term...
 Use the following table of returns from 1926 through 2017: Series Large stocks Small stocks Long-term corporate bonds Long-term government bonds U.S. Treasury bills Inflation Average return 12.1% 16.5 6.4 6.0 3.4 3.0 a. Determine the return on a portfolio that was equally invested in large-company stocks and long-term corporate bonds. (Do not round intermediate calculations and enter your answer as a percent rounded to 2 decimal places, e.g., 32.16.) b. What was the return on a portfolio that was...
The following table Year A Returns B Returns 2005 -4.7% 17.7% 2006 1.4% -8.1% 2007 -31.4% ...
The following table Year A Returns B Returns 2005 -4.7% 17.7% 2006 1.4% -8.1% 2007 -31.4% -25.4% 2008 -11.3% -3.6% 2009 31.4% 10.4% 2010 26.7% 9.2% 2011 22.6% 5.4% 2012 51.5% 42.6% 2013 35.7% 41.5% 2014 29.3% 39.4% 2015 26.2% 12.1% 2016 5.5% -0.2% 2017 43.3% 26.2% contains annual returns for the stocks of Company Upper A (Upper A) and Company Upper B (Upper B). The returns are calculated using end-of-year prices (adjusted for dividends and stock splits). Use the...
Annual and Average Returns for Stocks, Bonds, and T-Bills, 1950 to 2015 Stoeks Longter Treasury Bonds...
 Annual and Average Returns for Stocks, Bonds, and T-Bills, 1950 to 2015 Stoeks Longter Treasury Bonds 1-bills Average 12.60 4.400 2.00 th 1950 to 2015 1950 ta 1959 1960 to 1969 1970 to 1979 1980 to 1989 1990 to wa 1999 0.01 0.02 16.0 0.02 2000 to 2009 Annual 2010 Return Annual 2011 Return Annual Return Annual Return Annual 2014 Return annual 2015 Return 2010 to Average 2015 0.07 0.05 0.0€ You have a portfolio with an asset allocation of...
Use the following table: Average return 11.78% Series Large stocks Small stocks 16.48 Long-term corporate bonds Long-te...
 Use the following table: SeriesAverage returnLarge stocks11.78%Small stocks16.48Long-term corporate bonds6.24Long-term government bonds6.10U.S. Treasury bills3.84Inflation3.10a. Determine the return on a portfolio that was equally invested in large-company stocks and long-term corporate bonds. (Do not round intermediate calculations and enter your answer as a percent rounded to 2 decimal places, e.g., 32.16.) b. What was the return on a portfolio that was equally invested in small stocks and Treasury bills? (Do not round intermediate calculations and enter your answer as a percent rounded to...
Consider the following returns of two stocks in conjunction with the market M Std. dev. of...
 Consider the following returns of two stocks in conjunction with the market M Std. dev. of stock1 Std. dev. of stock 2 Std. dev. of market Expected return on the market rM 1096 Corr. of stock 1 with the market piM Corr. of stock 2 with the market p2M 0.7 Risk free rate T1 2096 T2 3096 15% 0.4 . According to the CAPM, what should the expected return of stock 1 and stock 2 be? (Note: Your answer should...
Keith holds a portfolio that is invested equally in three stocks (WD following table: WA w...
 Keith holds a portfolio that is invested equally in three stocks (WD following table: WA w 1/3). Each stock is described in the Stock Beta Standard Deviation Expected Return DET 0.7 AIL 1.0 INO 1.6 25% 38% 34% 8.0% 10.0% 13.5% An analyst has used market- and firm-specific information to make expected return estimates for each stock. The analyst's expected return estimates may or may not equal the stocks' required returns. The risk-free rate [Rr] is 6%, and the market...
Wilson holds a portfolio that invests equally in three stocks (WAWBWc following table: 1/3). Each...
 Wilson holds a portfolio that invests equally in three stocks (WAWBWc following table: 1/3). Each stock is described in the Stock Beta Standard Deviation Expected Return A 0.5 23% 38% 45% 7.5% 12.0% 14.0% C 2.0 An analyst has used market- and firm-specific information to generate expected return estimates for each stock. The analyst's expected return estimates may or may not equal the stocks' required returns. You've also determined that the risk-free rate [Rr] is 4%, and the market risk...
 B13. (Excel: Portfolio returns and stand 996 a standard deviation of 10%, and HMT has an expected return of 12% and a standard ation of 20%. The portfolio return and risk, of course, depend on the portfolio weight ard deviations) ARC has an expected return of dev,. rtfolio returns and stan- the correlation between ARC and HMT returns. Calculate the portfolio returns and ad dard deviations for the weights and correlations shown in the table PORTFOLIO STANDARD DEVIATION WEIGHTS FOR...
 Annual and Average Returns for Stocks, Bonds, and T-Bills, 1950 to 2017 Long-Term Treasury Bonds 6.6% 0.0 1.6 1950 to 2017 Average 1950 to 1959 Average 1960 to 1969 Average 1970 to 1979 Average 1980 to 1989 Average 1990 to 1999 Average 2000 to 2009 Average Annual Return 2011 Annual Return 2012 Annual Return 2013 Annual Return 2014 Annual Return 2015 Annual Return 2016 Annual Return 2017 Annual Return 2010 to 2017 Average Stocks 12.7% 20.9 8.7 7.5 18.2 19.0...
 Annual and Average Returns for Stocks, Bonds, and T-Bills, 1950 to 2015 Long-Term Treasury B onds 6.6% .0 1.6 5.7 13.5 Stocks 12.6% 9 28. 8.7 7.5 18.2 19.0 0.9 15.1 2.1 16. 32.4 13.7 1.4 1950 to 2015 Average 1950 to 1959 Average 1960 to 1969 Average 1970 to 1979 Average 1980 to 1989 Average 1990 to 1999 Average 2009 to 2009 Average 2010 Annual Return 2011 Annual Return 2012 Annual Return al Return 2013 Annual Return 2014 Annual...
 Use the following table of returns from 1926 through 2017: Series Large stocks Small stocks Long-term corporate bonds Long-term government bonds U.S. Treasury bills Inflation Average return 12.1% 16.5 6.4 6.0 3.4 3.0 a. Determine the return on a portfolio that was equally invested in large-company stocks and long-term corporate bonds. (Do not round intermediate calculations and enter your answer as a percent rounded to 2 decimal places, e.g., 32.16.) b. What was the return on a portfolio that was...
 Annual and Average Returns for Stocks, Bonds, and T-Bills, 1950 to 2015 Stoeks Longter Treasury Bonds 1-bills Average 12.60 4.400 2.00 th 1950 to 2015 1950 ta 1959 1960 to 1969 1970 to 1979 1980 to 1989 1990 to wa 1999 0.01 0.02 16.0 0.02 2000 to 2009 Annual 2010 Return Annual 2011 Return Annual Return Annual Return Annual 2014 Return annual 2015 Return 2010 to Average 2015 0.07 0.05 0.0€ You have a portfolio with an asset allocation of...
 Consider the following returns of two stocks in conjunction with the market M Std. dev. of stock1 Std. dev. of stock 2 Std. dev. of market Expected return on the market rM 1096 Corr. of stock 1 with the market piM Corr. of stock 2 with the market p2M 0.7 Risk free rate T1 2096 T2 3096 15% 0.4 . According to the CAPM, what should the expected return of stock 1 and stock 2 be? (Note: Your answer should...
 Keith holds a portfolio that is invested equally in three stocks (WD following table: WA w 1/3). Each stock is described in the Stock Beta Standard Deviation Expected Return DET 0.7 AIL 1.0 INO 1.6 25% 38% 34% 8.0% 10.0% 13.5% An analyst has used market- and firm-specific information to make expected return estimates for each stock. The analyst's expected return estimates may or may not equal the stocks' required returns. The risk-free rate [Rr] is 6%, and the market...
 Wilson holds a portfolio that invests equally in three stocks (WAWBWc following table: 1/3). Each stock is described in the Stock Beta Standard Deviation Expected Return A 0.5 23% 38% 45% 7.5% 12.0% 14.0% C 2.0 An analyst has used market- and firm-specific information to generate expected return estimates for each stock. The analyst's expected return estimates may or may not equal the stocks' required returns. You've also determined that the risk-free rate [Rr] is 4%, and the market risk...
Most questions answered within 3 hours.
-
Accent Software faces the following conditions. All of these
support Accent’s use of a market-penetration pricing...
asked 39 minutes ago -
A mathematically inclined friend emails you the following
instructions: "Meet me in the cafeteria the first...
asked 41 minutes ago -
A monopoly sells in two countries . The demand curves in the two
countries are p1...
asked 1 hour ago -
A .15kg rubber ball is bounced off a wall. Before hitting the
wall, the ball moves...
asked 2 hours ago -
A manufacturing company preparing to build a new plant is
considering three potential locations for it....
asked 2 hours ago -
B. If compound Y has approximately the same values of solubility
in toluene as compound X,...
asked 3 hours ago -
Oscar Inc. has inventory in Japan valued at 39,051,000 Yen one
year ago. One year ago...
asked 3 hours ago -
If Canada suffered from "fundamental disequilibrium," and its
government choose not to devalue its currency, a...
asked 3 hours ago -
4. How many input & output Key Value Pairs are passed into,
and emitted out of...
asked 3 hours ago -
Why would your heart not function well if constructed of
skeletal muscle? What is the particular...
asked 3 hours ago -
Please respond to this essay question in full essay form for
Chemistry 1102 Organic and Biochemistry:...
asked 3 hours ago -
Determine the head loss and velocity of flow in a water supply main
of 15.0 cm...
asked 3 hours ago