
 Please Help me to full the all
blank (11 blanks in total)
Please Help me to full the all
blank (11 blanks in total)
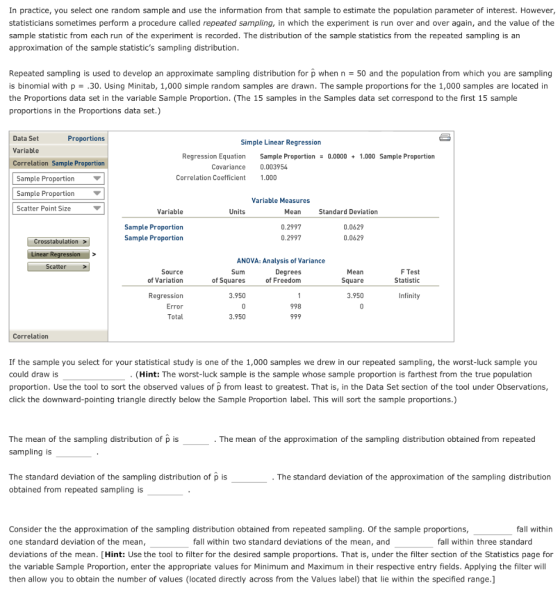
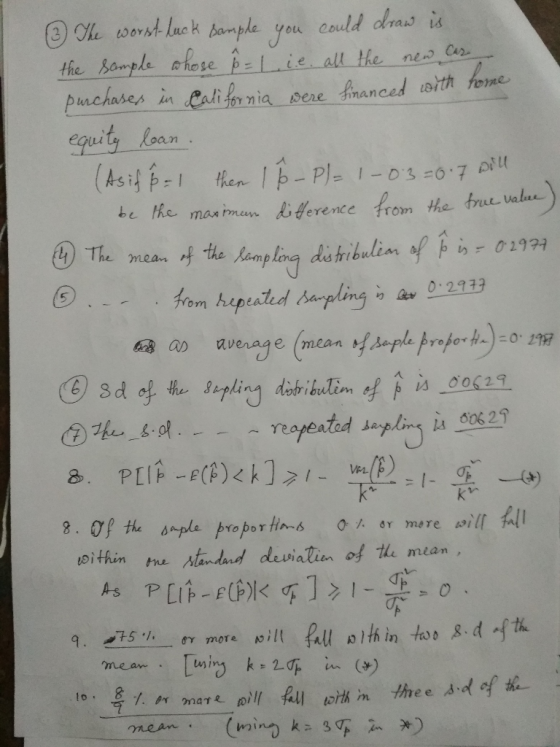
In practice, you select one random sample and use the information from that sample to estimate the population parameter of interest. However, statisticians sometimes perform a procedure called repeated sampling, in which the experiment is run over and over again, and the value of the sample statistic from each run of the experiment is recorded. The distribution of the sample statistics from the repeated sampling is an approximation of the sample statistic's sampling distribution Repeated sampling is used to develop an approximate sampling distribution for p when n = 50 and the population from which you are sampling is binomial with p .30. Using Minitab, 1,000 simple random samples are drawn. The sample proportions for the 1,000 samples are located in the Proportions data set in the variable Sample Proportion. (The 15 samples in the Samples data set correspond to the first 15 sample proportions in the Proportions data set.) Data Set Variable Correlation Sample Proportion Proportions Simple Linear Regression Regression Equation Sample Proportion0.00001.000 Sample Proportion Covariance 0.003954 Correlation Coefficient 1.000 Sample Proportion Sample Proportion Scatter Point Size Variable Measures Variable Units Mean 0.2997 0.2997 Standard Deviation Sample Proportion Sample Proportion 0.0629 0.0629 Crosstabulation > ANOVA: Analysis of Variance Scatter Source of Variation Sum of Squares Degrees of Freedom F Test Statisti ean Square Regression 3.950 3.950 Infinity Error 998 3.950 Correlation If the sample you select for your statistical study is one of the 1,000 samples we drew in our repeated sampling, the worst-luck sample you could draw is proportion. Use the tool to sort the observed values of p from least to greatest. That is, in the Data Set section of the tool under Observations, click the downward-pointing triangle directly below the Sample Proportion label. This will sort the sample proportions.) (Hint: The worst-luck sample is the sample whose sample proportion is farthest from the true population The mean of the sampling distribution of p is sampling is . The mean of the approximation of the sampling distribution obtained from repeated The standard deviation of the sampling distribution of p is obtained from repeated sampling is The standard deviation of the approximation of the sampling distribution Consider the the approximation of the sampling distribution obtained from repeated sampling. Of the sample proportions, one standard deviation of the mean, deviations of the mean. [Hint: Use the tool to filter for the desired sample proportions. That is, under the filter section of the Statistics page for the variable Sample Proportion, enter the appropriate values for Minimum and Maximum in their respective entry fields. Applying the filter will then allow you to obtain the number of values (located directly across from the Values label) that lie within the specified range.] fall within fall within two standard deviations of the mean, and fall within three standard
140 120 Examine the frequency histogram for the the approximation of the sampling distribution obtained from repeated sampling shown at right. A normal curve is superimposed on the histogram. 100 80 Based on the histogram and your answers to the previous set of questions, the the approximation of the sampling distribution obtained from repeated sampling appears to be 60 40 20 skewed to the right approximately normal approximately uniform neither normal nor uniform 0 0.06 0.12 0.18 0.24 0.30 0.36 0.42 0.48 Values of p-hat Minitab and all other trademarks and logos for the Company's products and services are the exclusive property of Minitab Inc. All other marks referenced remain the property of their respective owners. See minitab.com for more information.
Homework Answers

If you satisfy with this please like it
Add Answer to:
6. The sampling distribution of the sample proportion In 2007, about 30% of new-car purchases in ...
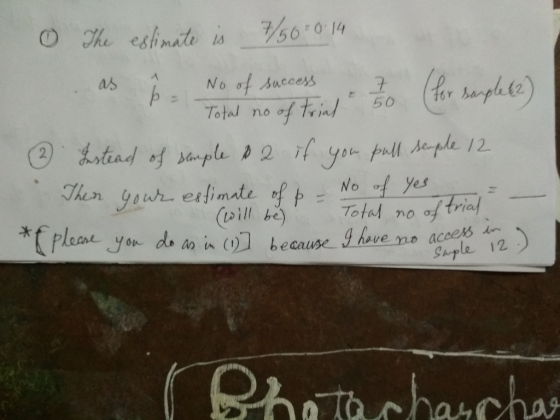
6. The sampling distribution of the sample proportion Aa Aa In 2007, about 14% of new-car purchas...
 6. The sampling distribution of the sample proportion Aa Aa In 2007, about 14% of new-car purchases in New York were financed with a home equity loan. [Source: "Auto Industry Feels the Pain of Tight Credit," The New York Times, May 27, 2008.] The ongoing process of new-car purchases in New York can be viewed as an infinite population Define p as the proportion of the population of new-car purchases in New York that are financed with a home equity...
6. The sampling distribution of the sample proportion Aa Aa In 2007, about 14% of new-car...
 6. The sampling distribution of the sample proportion Aa Aa In 2007, about 14% of new-car purchases in New York were financed with a home equity loan. [Source: "Auto Industry Feels the Pain of Tight Credit," The New York Times, May 27, 2008.] The ongoing process of new-car purchases in New York can be viewed as an infinite population Define p as the proportion of the population of new-car purchases in New York that are financed with a home equity...
3. The sampling distribution of the sample proportion Aa Aa In 2007, about 20% of new-car purchas...
 3. The sampling distribution of the sample proportion Aa Aa In 2007, about 20% of new-car purchases in Florida were financed with a home equity loan. [Source: "Auto Industry Feels the Pain of Tight Credit," The New York Times, May 27, 2008.] The ongoing process of new-car purchases in Florida can be viewed as an infinite population. Define p as the proportion of the population of new-car purchases in Florida that are financed with a home equity loan. The true...
Selecting a random sample is an example of a statistical experiment, and the sample statistic p i...
 Selecting a random sample is an example of a statistical experiment, and the sample statistic p is a numerical description of the result of the experiment. Therefore, p is a random variable. The probability distribution of p is called the sampling distribution of p In practice, you select one random sample and use the information from that sample to estimate the population parameter of interest. However statisticians sometimes perform a procedure called repeated sampling, in which the experiment is run...
Data Se Sample Variables 1 Proportions Observations 1000 p-bar for 1,000 samples (n 50] drawn fro...
 Data Se Sample Variables 1 Proportions Observations 1000 p-bar for 1,000 samples (n 50] drawn from a binomial population (p 0.30) Minitab was used to generate the samples. Observations> Observations Variable Type Form Values Missing Sample Proportion Quantitative Numeric 1000 Variable Correlation Correlation If the sample you select for your statistical study is one of the 1,000 samples we drew in our repeated sampling, the worst-luck sample you could draw proportion. Use the tool to sort the observed values of...
, Samples In 30) drawn from a uniform distribution la Minitab was used to generate the...
 , Samples In 30) drawn from a uniform distribution la Minitab was used to generate the samples. es 300, b 500) Variables 15 Observations Variable TypeFormValues Missing Sample 1 Quantitative Sample 2 Quantitative Numeric Sample 3 Quantitative Numeric Sample 4 Quantitative Sample 5 ive Sample 6 Quantitative Sample 7 Quantitative Observations Sample 8 Quantitative Numeric Sample 9 Quantitative Sample 10 Quantitative Sample 11 Quantitative Sample 12 Quantitative Sample 13 Quantitative Sample 14 Quantitative Sample 15 Quantitative Numeric Numeric Variable Numeric...
I need help with these sampling charts Your Turn (Continued) Sampling Distribution (n = 50) Sampling...
 I need help with these sampling charts
Your Turn (Continued) Sampling Distribution (n = 50) Sampling Dotplot of Proportion Len Tail Two-Tall Right Tall Sangles - 120 0.591 std error -0.068 40 30 20 10 0 0.40 0.45 0.50 0.55 0.65 0.70 0.75 0.80 In the simulation, when we are building a sampling distribution, what does each dot represent in the graph? A random sample of 50 college students - The population proportion of female college students at is 60%,...
I need help with these sampling charts
Your Turn (Continued) Sampling Distribution (n = 50) Sampling Dotplot of Proportion Len Tail Two-Tall Right Tall Sangles - 120 0.591 std error -0.068 40 30 20 10 0 0.40 0.45 0.50 0.55 0.65 0.70 0.75 0.80 In the simulation, when we are building a sampling distribution, what does each dot represent in the graph? A random sample of 50 college students - The population proportion of female college students at is 60%,...
On the Sampling Distribution for the Sample Proportion app in artofstat.com, Select Populatio Proportion (p) to be...
 On the Sampling Distribution for the Sample Proportion app in artofstat.com, Select Populatio Proportion (p) to be 0.1. Keep the sample size (n) at 10. Under Select how many samples (of size n) you want to simulate drawing from the population, CHANGE this to 10,000 samples. Click on Draw Sample(s) ONCE. Notice the center, spread and shape of the distribution. Change the value of p by increments of 0.1 (0.1,0.2,0.3,0.4,0.5, 0.6, 0.7.0.8,0.9, 1.0). What happens to the symmetry as p...
Lesson 6.2.4: Binomial Distribution and Sample Proportions A sample proportion, such as the one computed in...
 Lesson 6.2.4: Binomial Distribution and Sample Proportions A sample proportion, such as the one computed in Question 4, is equal to a number of successes (x), divided by the sample size (n). The notation for a sample proportion is p, and it is computed by the formula p = Each value of x corresponds to a unique sample proportion ( p ), as computed by this formula. For example, x = 1 implies p = + - 0.10. These events,...
CLT for proportions. Define the term “sampling distribution” of the sample proportion, and describe how the...
CLT for proportions. Define the term “sampling distribution” of the sample proportion, and describe how the shape, center, and spread of the sampling distribution change as the sample size increases when p = 0.1.
 6. The sampling distribution of the sample proportion Aa Aa In 2007, about 14% of new-car purchases in New York were financed with a home equity loan. [Source: "Auto Industry Feels the Pain of Tight Credit," The New York Times, May 27, 2008.] The ongoing process of new-car purchases in New York can be viewed as an infinite population Define p as the proportion of the population of new-car purchases in New York that are financed with a home equity...
 6. The sampling distribution of the sample proportion Aa Aa In 2007, about 14% of new-car purchases in New York were financed with a home equity loan. [Source: "Auto Industry Feels the Pain of Tight Credit," The New York Times, May 27, 2008.] The ongoing process of new-car purchases in New York can be viewed as an infinite population Define p as the proportion of the population of new-car purchases in New York that are financed with a home equity...
 3. The sampling distribution of the sample proportion Aa Aa In 2007, about 20% of new-car purchases in Florida were financed with a home equity loan. [Source: "Auto Industry Feels the Pain of Tight Credit," The New York Times, May 27, 2008.] The ongoing process of new-car purchases in Florida can be viewed as an infinite population. Define p as the proportion of the population of new-car purchases in Florida that are financed with a home equity loan. The true...
 Selecting a random sample is an example of a statistical experiment, and the sample statistic p is a numerical description of the result of the experiment. Therefore, p is a random variable. The probability distribution of p is called the sampling distribution of p In practice, you select one random sample and use the information from that sample to estimate the population parameter of interest. However statisticians sometimes perform a procedure called repeated sampling, in which the experiment is run...
 Data Se Sample Variables 1 Proportions Observations 1000 p-bar for 1,000 samples (n 50] drawn from a binomial population (p 0.30) Minitab was used to generate the samples. Observations> Observations Variable Type Form Values Missing Sample Proportion Quantitative Numeric 1000 Variable Correlation Correlation If the sample you select for your statistical study is one of the 1,000 samples we drew in our repeated sampling, the worst-luck sample you could draw proportion. Use the tool to sort the observed values of...
 , Samples In 30) drawn from a uniform distribution la Minitab was used to generate the samples. es 300, b 500) Variables 15 Observations Variable TypeFormValues Missing Sample 1 Quantitative Sample 2 Quantitative Numeric Sample 3 Quantitative Numeric Sample 4 Quantitative Sample 5 ive Sample 6 Quantitative Sample 7 Quantitative Observations Sample 8 Quantitative Numeric Sample 9 Quantitative Sample 10 Quantitative Sample 11 Quantitative Sample 12 Quantitative Sample 13 Quantitative Sample 14 Quantitative Sample 15 Quantitative Numeric Numeric Variable Numeric...
 I need help with these sampling charts
Your Turn (Continued) Sampling Distribution (n = 50) Sampling Dotplot of Proportion Len Tail Two-Tall Right Tall Sangles - 120 0.591 std error -0.068 40 30 20 10 0 0.40 0.45 0.50 0.55 0.65 0.70 0.75 0.80 In the simulation, when we are building a sampling distribution, what does each dot represent in the graph? A random sample of 50 college students - The population proportion of female college students at is 60%,...
I need help with these sampling charts
Your Turn (Continued) Sampling Distribution (n = 50) Sampling Dotplot of Proportion Len Tail Two-Tall Right Tall Sangles - 120 0.591 std error -0.068 40 30 20 10 0 0.40 0.45 0.50 0.55 0.65 0.70 0.75 0.80 In the simulation, when we are building a sampling distribution, what does each dot represent in the graph? A random sample of 50 college students - The population proportion of female college students at is 60%,...
 On the Sampling Distribution for the Sample Proportion app in artofstat.com, Select Populatio Proportion (p) to be 0.1. Keep the sample size (n) at 10. Under Select how many samples (of size n) you want to simulate drawing from the population, CHANGE this to 10,000 samples. Click on Draw Sample(s) ONCE. Notice the center, spread and shape of the distribution. Change the value of p by increments of 0.1 (0.1,0.2,0.3,0.4,0.5, 0.6, 0.7.0.8,0.9, 1.0). What happens to the symmetry as p...
 Lesson 6.2.4: Binomial Distribution and Sample Proportions A sample proportion, such as the one computed in Question 4, is equal to a number of successes (x), divided by the sample size (n). The notation for a sample proportion is p, and it is computed by the formula p = Each value of x corresponds to a unique sample proportion ( p ), as computed by this formula. For example, x = 1 implies p = + - 0.10. These events,...
Most questions answered within 3 hours.
-
Describe how the file manager allocates a file to a single user.
List the steps that...
asked 5 minutes ago -
For the following reaction:
IBr(g) + 4F2(g) → IF5(g) +
BrF3(g)
Compound
ΔH°f (kJ mol-1)...
asked 7 minutes ago -
Assuming the simple probability of even A is given as P(A) and
the simple probability of...
asked 9 minutes ago -
2.- It is known that 20% of the students on campus are smokers.
If 8 students...
asked 10 minutes ago -
Provide a summary/reflection of what you gleaned of how law
enforcement is effect by Unconventional Weapons...
asked 31 minutes ago -
From the following heats of combustion,
CH3OH(l) + 3/2O2(g) → CO2(g) +
2H2O(l)
ΔHorxn = –726.4...
asked 24 minutes ago -
Floating Point Representation
Consider a computer that stores information using 10 bits words.
The first bit...
asked 53 minutes ago -
. The theoretical weight percent of carbon in (CH3)3N is:
A. 20.32% B. 81.95% C. 9.97%...
asked 46 minutes ago -
The rate of a certain reaction is given by the following rate
law:
rate = k[H2][I2]...
asked 41 minutes ago -
A 10,000 uF capacitor is in series with a 1 uH inductor. What is
Zeq of...
asked 45 minutes ago -
Draw the molecular orbital diagram for O2-
(oxygen molecule with a negative charge).
asked 1 hour ago -
Of all the different weapons discussed in this chapter that make
up CBRNE,
Which group do...
asked 59 minutes ago