
I need help with these sampling charts
Homework Answers
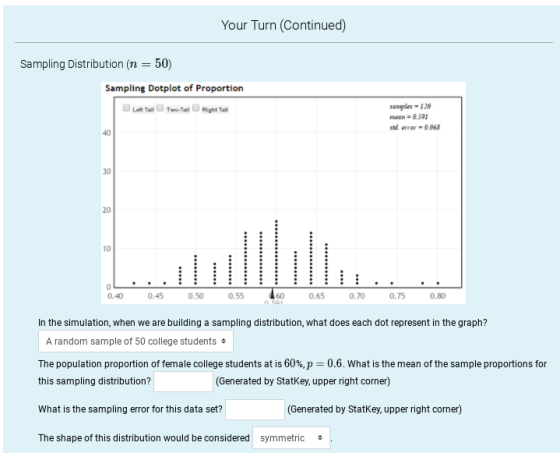
Sampling distribution ( n = 50)
- The mean of the sample proportions for the sampling distribution = 0.591
- The standard error = 0.068
Sampling distribution ( n = 250)
- The mean of the sample proportions for the sampling distribution = 0.398
- The standard error = 0.030
- The distribution with sample size 50 has a proportion mean closer to the population proportion .
Add Answer to:
I need help with these sampling charts
Your Turn (Continued) Sampling Distribution (n = 50) Sampling...
Which of the following is true about the sampling distribution of means? Shape of the sampling...
Which of the following is true about the sampling distribution of means? Shape of the sampling distribution of means is always the same shape as the population distribution, no matter what the sample size is. Sampling distribution of the mean is always right skewed since means cannot be smaller than 0. Sampling distributions of means are always nearly normal. Sampling distributions of means get closer to normality as the sample size increases.
6. The sampling distribution of the sample proportion In 2007, about 30% of new-car purchases in ...
 Please Help me to full the all
blank (11 blanks in total)
6. The sampling distribution of the sample proportion In 2007, about 30% of new-car purchases in California were financed with a home equity loan. [Source: "Auto Industry Feels the Pain of Tight Credit," The New York Times, May 27, 2008.] The ongoing process of new-car purchases in California can be viewed as an infinite population Define p as the proportion of the population of new-car purchases in California...
Please Help me to full the all
blank (11 blanks in total)
6. The sampling distribution of the sample proportion In 2007, about 30% of new-car purchases in California were financed with a home equity loan. [Source: "Auto Industry Feels the Pain of Tight Credit," The New York Times, May 27, 2008.] The ongoing process of new-car purchases in California can be viewed as an infinite population Define p as the proportion of the population of new-car purchases in California...
How do the standard errors of the sampling distributions of sample proportions compare if the first distribution uses samples of size 25 and the second distribution uses samples of size 50? Select one...
How do the standard errors of the sampling distributions of sample proportions compare if the first distribution uses samples of size 25 and the second distribution uses samples of size 50? Select one: a. the standard error for the distribution with sample size 25 is greater than the standard error for the distribution with sample size 50 b. the standard errors are the same c. the standard error for the distribution with sample size 25 is smaller than the standard...
Data Se Sample Variables 1 Proportions Observations 1000 p-bar for 1,000 samples (n 50] drawn fro...
 Data Se Sample Variables 1 Proportions Observations 1000 p-bar for 1,000 samples (n 50] drawn from a binomial population (p 0.30) Minitab was used to generate the samples. Observations> Observations Variable Type Form Values Missing Sample Proportion Quantitative Numeric 1000 Variable Correlation Correlation If the sample you select for your statistical study is one of the 1,000 samples we drew in our repeated sampling, the worst-luck sample you could draw proportion. Use the tool to sort the observed values of...
Consider a sampling distribution with p=0.09 and samples of size n each. Using the appropriate formulas,...
Consider a sampling distribution with p=0.09 and samples of size n each. Using the appropriate formulas, find the mean and the standard deviation of the sampling distribution of the sample proportion. a. For a random sample of size n=4000. b. For a random sample of size n=1000. c. For a random sample of size n=250.
6. The sampling distribution of the sample proportion Aa Aa In 2007, about 14% of new-car purchas...
 6. The sampling distribution of the sample proportion Aa Aa In 2007, about 14% of new-car purchases in New York were financed with a home equity loan. [Source: "Auto Industry Feels the Pain of Tight Credit," The New York Times, May 27, 2008.] The ongoing process of new-car purchases in New York can be viewed as an infinite population Define p as the proportion of the population of new-car purchases in New York that are financed with a home equity...
6. The sampling distribution of the sample proportion Aa Aa In 2007, about 14% of new-car...
 6. The sampling distribution of the sample proportion Aa Aa In 2007, about 14% of new-car purchases in New York were financed with a home equity loan. [Source: "Auto Industry Feels the Pain of Tight Credit," The New York Times, May 27, 2008.] The ongoing process of new-car purchases in New York can be viewed as an infinite population Define p as the proportion of the population of new-car purchases in New York that are financed with a home equity...
The purpose of the questions is to hammer home that the distribution of sampling means for...
 The purpose of the questions is to hammer home that the distribution of sampling means for a large number of samples always makes a normal curve. 2) The second question concerns the following pair of sample mean distributions: Which distribution came from samples with a larger sample size, the one on the left or the one on the right a) b) Why is the sampling distribution on the right a narrower distribution?
Selecting a random sample is an example of a statistical experiment, and the sample statistic p i...
 Selecting a random sample is an example of a statistical experiment, and the sample statistic p is a numerical description of the result of the experiment. Therefore, p is a random variable. The probability distribution of p is called the sampling distribution of p In practice, you select one random sample and use the information from that sample to estimate the population parameter of interest. However statisticians sometimes perform a procedure called repeated sampling, in which the experiment is run...
Let's say I am interested in creating a sampling distribution with 25 students per sample to...
Let's say I am interested in creating a sampling distribution with 25 students per sample to calculate the average number of credits PCC students are taking this term. In your own words, describe how we would create a histogram to represent a sampling distribution 25 observations per sample. For full credit, make sure your solution distinguishes your answer from a population distribution, and a sampling distribution of proportions.
 Please Help me to full the all
blank (11 blanks in total)
6. The sampling distribution of the sample proportion In 2007, about 30% of new-car purchases in California were financed with a home equity loan. [Source: "Auto Industry Feels the Pain of Tight Credit," The New York Times, May 27, 2008.] The ongoing process of new-car purchases in California can be viewed as an infinite population Define p as the proportion of the population of new-car purchases in California...
Please Help me to full the all
blank (11 blanks in total)
6. The sampling distribution of the sample proportion In 2007, about 30% of new-car purchases in California were financed with a home equity loan. [Source: "Auto Industry Feels the Pain of Tight Credit," The New York Times, May 27, 2008.] The ongoing process of new-car purchases in California can be viewed as an infinite population Define p as the proportion of the population of new-car purchases in California...
 Data Se Sample Variables 1 Proportions Observations 1000 p-bar for 1,000 samples (n 50] drawn from a binomial population (p 0.30) Minitab was used to generate the samples. Observations> Observations Variable Type Form Values Missing Sample Proportion Quantitative Numeric 1000 Variable Correlation Correlation If the sample you select for your statistical study is one of the 1,000 samples we drew in our repeated sampling, the worst-luck sample you could draw proportion. Use the tool to sort the observed values of...
 6. The sampling distribution of the sample proportion Aa Aa In 2007, about 14% of new-car purchases in New York were financed with a home equity loan. [Source: "Auto Industry Feels the Pain of Tight Credit," The New York Times, May 27, 2008.] The ongoing process of new-car purchases in New York can be viewed as an infinite population Define p as the proportion of the population of new-car purchases in New York that are financed with a home equity...
 6. The sampling distribution of the sample proportion Aa Aa In 2007, about 14% of new-car purchases in New York were financed with a home equity loan. [Source: "Auto Industry Feels the Pain of Tight Credit," The New York Times, May 27, 2008.] The ongoing process of new-car purchases in New York can be viewed as an infinite population Define p as the proportion of the population of new-car purchases in New York that are financed with a home equity...
 The purpose of the questions is to hammer home that the distribution of sampling means for a large number of samples always makes a normal curve. 2) The second question concerns the following pair of sample mean distributions: Which distribution came from samples with a larger sample size, the one on the left or the one on the right a) b) Why is the sampling distribution on the right a narrower distribution?
 Selecting a random sample is an example of a statistical experiment, and the sample statistic p is a numerical description of the result of the experiment. Therefore, p is a random variable. The probability distribution of p is called the sampling distribution of p In practice, you select one random sample and use the information from that sample to estimate the population parameter of interest. However statisticians sometimes perform a procedure called repeated sampling, in which the experiment is run...
Most questions answered within 3 hours.
-
The mass structure of a spiral galaxy may be determined by
measurement of its___________ ________________
asked 3 minutes ago -
How do you define corrupt power? Lord Acton, a British historian
of the late 19th century,...
asked 14 seconds ago -
1. If demand deceases and supply remains constant, what happens
to the market equilibrium?
A. Quantity...
asked 6 minutes ago -
A ball of mass 81 kg is dropped from a height of 22 m. What is...
asked 7 minutes ago -
There are 3 golden retrievers, 2 dachshunds, and 4 chocolate
labs in a kennel. Two dogs...
asked 23 minutes ago -
When a fixture of real property is physically detached from the
real property, it is known...
asked 21 minutes ago -
Imagine you are driving around a horizontal circular track (such
as a roundabout at an intersection...
asked 37 minutes ago -
Draw the structures that correspond to the following names.
Correct any names that are not in...
asked 45 minutes ago -
Do elephants and cows present an interesting dichotomy when
viewed from the perspective of property rights?
asked 57 minutes ago -
USE an API
You have a drop down list of 4 cities.
Upon selecting a particular...
asked 57 minutes ago -
Which type of chemical reaction is regulated by altering an
enzyme's function?
a.) irreversible
b.) reversible
asked 1 hour ago -
Supply management is a developing ____________ and an area of
management _______________.
1. discipline / responsibility...
asked 1 hour ago