

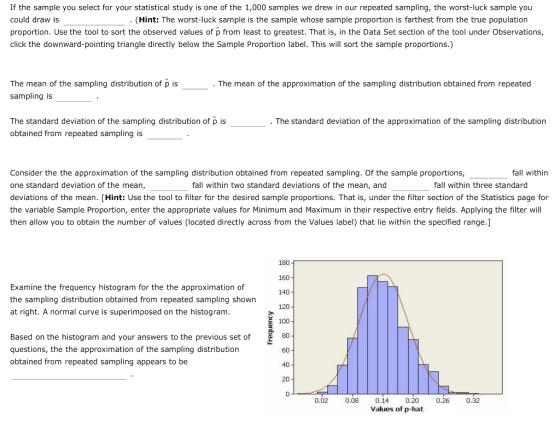
If the sample you select for your statistical study is one of the 1,000 samples we drew in our repeated sampling, the worst-luck sample you could draw is proportion. Use the tool to sort the observed values of p from least to greatest. That is, in the Data Set section of the tool under Observations, click the downward-pointing triangle directly below the Sample Proportion label. This will sort the sample proportions.) (Hint: The worst-luck sample is the sample whose sample proportion is farthest from the true population The mean of the sampling distribution of p is sampling is . The mean of the approximation of the sampling distribution obtained from repeated The standard deviation of the sampling distribution of p is obtained from repeated sampling is . The standard deviation of the approximation of the sampling distribution fall withirn Consider the the approximation of the sampling distribution obtained from repeated sampling. Of the sample proportions, one standard deviation of the mean, deviations of the mean. [Hint: Use the tool to filter for the desired sample proportions. That is, under the filter section of the Statistics page for the variable Sample Proportion, enter the appropriate values for Minimum and Maximum in their respective entry fields. Applying the filter will then allow you to obtain the number of values (located directly across from the Values label) that lie within the specified range.] fall within two standard deviations of the mean, and fall within three standard Examine the frequency histogram for the the approximation of the sampling distribution obtained from repeated sampling shown at right. A noral curve is superimposed on the histogram 180 160 140 120 Based on the histogram and your answers to the previous set of questions, the the approximation of the sampling distribution obtained from repeated sampling appears to be 60 40 20 0 0.02 0.08 0.26 0.32 0.14 Values of p-hat 0.20
Homework Answers


Add Answer to:
6. The sampling distribution of the sample proportion Aa Aa In 2007, about 14% of new-car purchas...
6. The sampling distribution of the sample proportion Aa Aa In 2007, about 14% of new-car...
 6. The sampling distribution of the sample proportion Aa Aa In 2007, about 14% of new-car purchases in New York were financed with a home equity loan. [Source: "Auto Industry Feels the Pain of Tight Credit," The New York Times, May 27, 2008.] The ongoing process of new-car purchases in New York can be viewed as an infinite population Define p as the proportion of the population of new-car purchases in New York that are financed with a home equity...
3. The sampling distribution of the sample proportion Aa Aa In 2007, about 20% of new-car purchas...
 3. The sampling distribution of the sample proportion Aa Aa In 2007, about 20% of new-car purchases in Florida were financed with a home equity loan. [Source: "Auto Industry Feels the Pain of Tight Credit," The New York Times, May 27, 2008.] The ongoing process of new-car purchases in Florida can be viewed as an infinite population. Define p as the proportion of the population of new-car purchases in Florida that are financed with a home equity loan. The true...
6. The sampling distribution of the sample proportion In 2007, about 30% of new-car purchases in ...
 Please Help me to full the all
blank (11 blanks in total)
6. The sampling distribution of the sample proportion In 2007, about 30% of new-car purchases in California were financed with a home equity loan. [Source: "Auto Industry Feels the Pain of Tight Credit," The New York Times, May 27, 2008.] The ongoing process of new-car purchases in California can be viewed as an infinite population Define p as the proportion of the population of new-car purchases in California...
Please Help me to full the all
blank (11 blanks in total)
6. The sampling distribution of the sample proportion In 2007, about 30% of new-car purchases in California were financed with a home equity loan. [Source: "Auto Industry Feels the Pain of Tight Credit," The New York Times, May 27, 2008.] The ongoing process of new-car purchases in California can be viewed as an infinite population Define p as the proportion of the population of new-car purchases in California...
Data Se Sample Variables 1 Proportions Observations 1000 p-bar for 1,000 samples (n 50] drawn fro...
 Data Se Sample Variables 1 Proportions Observations 1000 p-bar for 1,000 samples (n 50] drawn from a binomial population (p 0.30) Minitab was used to generate the samples. Observations> Observations Variable Type Form Values Missing Sample Proportion Quantitative Numeric 1000 Variable Correlation Correlation If the sample you select for your statistical study is one of the 1,000 samples we drew in our repeated sampling, the worst-luck sample you could draw proportion. Use the tool to sort the observed values of...
Selecting a random sample is an example of a statistical experiment, and the sample statistic p i...
 Selecting a random sample is an example of a statistical experiment, and the sample statistic p is a numerical description of the result of the experiment. Therefore, p is a random variable. The probability distribution of p is called the sampling distribution of p In practice, you select one random sample and use the information from that sample to estimate the population parameter of interest. However statisticians sometimes perform a procedure called repeated sampling, in which the experiment is run...
, Samples In 30) drawn from a uniform distribution la Minitab was used to generate the...
 , Samples In 30) drawn from a uniform distribution la Minitab was used to generate the samples. es 300, b 500) Variables 15 Observations Variable TypeFormValues Missing Sample 1 Quantitative Sample 2 Quantitative Numeric Sample 3 Quantitative Numeric Sample 4 Quantitative Sample 5 ive Sample 6 Quantitative Sample 7 Quantitative Observations Sample 8 Quantitative Numeric Sample 9 Quantitative Sample 10 Quantitative Sample 11 Quantitative Sample 12 Quantitative Sample 13 Quantitative Sample 14 Quantitative Sample 15 Quantitative Numeric Numeric Variable Numeric...
On the Sampling Distribution for the Sample Proportion app in artofstat.com, Select Populatio Proportion (p) to be...
 On the Sampling Distribution for the Sample Proportion app in artofstat.com, Select Populatio Proportion (p) to be 0.1. Keep the sample size (n) at 10. Under Select how many samples (of size n) you want to simulate drawing from the population, CHANGE this to 10,000 samples. Click on Draw Sample(s) ONCE. Notice the center, spread and shape of the distribution. Change the value of p by increments of 0.1 (0.1,0.2,0.3,0.4,0.5, 0.6, 0.7.0.8,0.9, 1.0). What happens to the symmetry as p...
I need help with these sampling charts Your Turn (Continued) Sampling Distribution (n = 50) Sampling...
 I need help with these sampling charts
Your Turn (Continued) Sampling Distribution (n = 50) Sampling Dotplot of Proportion Len Tail Two-Tall Right Tall Sangles - 120 0.591 std error -0.068 40 30 20 10 0 0.40 0.45 0.50 0.55 0.65 0.70 0.75 0.80 In the simulation, when we are building a sampling distribution, what does each dot represent in the graph? A random sample of 50 college students - The population proportion of female college students at is 60%,...
I need help with these sampling charts
Your Turn (Continued) Sampling Distribution (n = 50) Sampling Dotplot of Proportion Len Tail Two-Tall Right Tall Sangles - 120 0.591 std error -0.068 40 30 20 10 0 0.40 0.45 0.50 0.55 0.65 0.70 0.75 0.80 In the simulation, when we are building a sampling distribution, what does each dot represent in the graph? A random sample of 50 college students - The population proportion of female college students at is 60%,...
Lesson 6.2.4: Binomial Distribution and Sample Proportions A sample proportion, such as the one computed in...
 Lesson 6.2.4: Binomial Distribution and Sample Proportions A sample proportion, such as the one computed in Question 4, is equal to a number of successes (x), divided by the sample size (n). The notation for a sample proportion is p, and it is computed by the formula p = Each value of x corresponds to a unique sample proportion ( p ), as computed by this formula. For example, x = 1 implies p = + - 0.10. These events,...
6. Expected value and standard deviation of the sample proportion (finite population)A Aa A local cell...
 6. Expected value and standard deviation of the sample proportion (finite population)A Aa A local cell phone store just recelved a shipment of 267 cell phone chargers. The manager wants to estimate the number of defective cell phone chargers in the shipment. Rather than checking every cell phone charger, the manager plans to take a simple random sample of size 80 in order to estimate the proportion of defective cel phone chargers in the shipment. If the sample proportion of...
 6. The sampling distribution of the sample proportion Aa Aa In 2007, about 14% of new-car purchases in New York were financed with a home equity loan. [Source: "Auto Industry Feels the Pain of Tight Credit," The New York Times, May 27, 2008.] The ongoing process of new-car purchases in New York can be viewed as an infinite population Define p as the proportion of the population of new-car purchases in New York that are financed with a home equity...
 3. The sampling distribution of the sample proportion Aa Aa In 2007, about 20% of new-car purchases in Florida were financed with a home equity loan. [Source: "Auto Industry Feels the Pain of Tight Credit," The New York Times, May 27, 2008.] The ongoing process of new-car purchases in Florida can be viewed as an infinite population. Define p as the proportion of the population of new-car purchases in Florida that are financed with a home equity loan. The true...
 Please Help me to full the all
blank (11 blanks in total)
6. The sampling distribution of the sample proportion In 2007, about 30% of new-car purchases in California were financed with a home equity loan. [Source: "Auto Industry Feels the Pain of Tight Credit," The New York Times, May 27, 2008.] The ongoing process of new-car purchases in California can be viewed as an infinite population Define p as the proportion of the population of new-car purchases in California...
Please Help me to full the all
blank (11 blanks in total)
6. The sampling distribution of the sample proportion In 2007, about 30% of new-car purchases in California were financed with a home equity loan. [Source: "Auto Industry Feels the Pain of Tight Credit," The New York Times, May 27, 2008.] The ongoing process of new-car purchases in California can be viewed as an infinite population Define p as the proportion of the population of new-car purchases in California...
 Data Se Sample Variables 1 Proportions Observations 1000 p-bar for 1,000 samples (n 50] drawn from a binomial population (p 0.30) Minitab was used to generate the samples. Observations> Observations Variable Type Form Values Missing Sample Proportion Quantitative Numeric 1000 Variable Correlation Correlation If the sample you select for your statistical study is one of the 1,000 samples we drew in our repeated sampling, the worst-luck sample you could draw proportion. Use the tool to sort the observed values of...
 Selecting a random sample is an example of a statistical experiment, and the sample statistic p is a numerical description of the result of the experiment. Therefore, p is a random variable. The probability distribution of p is called the sampling distribution of p In practice, you select one random sample and use the information from that sample to estimate the population parameter of interest. However statisticians sometimes perform a procedure called repeated sampling, in which the experiment is run...
 , Samples In 30) drawn from a uniform distribution la Minitab was used to generate the samples. es 300, b 500) Variables 15 Observations Variable TypeFormValues Missing Sample 1 Quantitative Sample 2 Quantitative Numeric Sample 3 Quantitative Numeric Sample 4 Quantitative Sample 5 ive Sample 6 Quantitative Sample 7 Quantitative Observations Sample 8 Quantitative Numeric Sample 9 Quantitative Sample 10 Quantitative Sample 11 Quantitative Sample 12 Quantitative Sample 13 Quantitative Sample 14 Quantitative Sample 15 Quantitative Numeric Numeric Variable Numeric...
 On the Sampling Distribution for the Sample Proportion app in artofstat.com, Select Populatio Proportion (p) to be 0.1. Keep the sample size (n) at 10. Under Select how many samples (of size n) you want to simulate drawing from the population, CHANGE this to 10,000 samples. Click on Draw Sample(s) ONCE. Notice the center, spread and shape of the distribution. Change the value of p by increments of 0.1 (0.1,0.2,0.3,0.4,0.5, 0.6, 0.7.0.8,0.9, 1.0). What happens to the symmetry as p...
 I need help with these sampling charts
Your Turn (Continued) Sampling Distribution (n = 50) Sampling Dotplot of Proportion Len Tail Two-Tall Right Tall Sangles - 120 0.591 std error -0.068 40 30 20 10 0 0.40 0.45 0.50 0.55 0.65 0.70 0.75 0.80 In the simulation, when we are building a sampling distribution, what does each dot represent in the graph? A random sample of 50 college students - The population proportion of female college students at is 60%,...
I need help with these sampling charts
Your Turn (Continued) Sampling Distribution (n = 50) Sampling Dotplot of Proportion Len Tail Two-Tall Right Tall Sangles - 120 0.591 std error -0.068 40 30 20 10 0 0.40 0.45 0.50 0.55 0.65 0.70 0.75 0.80 In the simulation, when we are building a sampling distribution, what does each dot represent in the graph? A random sample of 50 college students - The population proportion of female college students at is 60%,...
 Lesson 6.2.4: Binomial Distribution and Sample Proportions A sample proportion, such as the one computed in Question 4, is equal to a number of successes (x), divided by the sample size (n). The notation for a sample proportion is p, and it is computed by the formula p = Each value of x corresponds to a unique sample proportion ( p ), as computed by this formula. For example, x = 1 implies p = + - 0.10. These events,...
 6. Expected value and standard deviation of the sample proportion (finite population)A Aa A local cell phone store just recelved a shipment of 267 cell phone chargers. The manager wants to estimate the number of defective cell phone chargers in the shipment. Rather than checking every cell phone charger, the manager plans to take a simple random sample of size 80 in order to estimate the proportion of defective cel phone chargers in the shipment. If the sample proportion of...
Most questions answered within 3 hours.
-
Assume you used Analysis of Variance to compare the student debt
for 100 college graduates--25 from...
asked 51 seconds from now -
a company just paid an annual dividend of $1.20 per share. the
share is priced at...
asked 1 minute from now -
What was happening in the workplace before the signing of the
Civil Rights Act of 1964?
asked 2 minutes ago -
The probability that a randomly selected teenager studied at
least once during a week was only...
asked 7 minutes ago -
At 20.0°C, the vapor pressure of ethanol is 45.0 torr, and the
vapor pressure of methanol...
asked 9 minutes ago -
13.
Given the following definitions:
U = {1, 2, 3, 4, 5, 6, 7}
A =...
asked 17 minutes ago -
1. Let us again continue with analyses of data from the study of
M Daviglus et...
asked 18 minutes ago -
Consider the following data for a dependent variable y and two
independent variables, x1 and x2....
asked 17 minutes ago -
Research paper on a Sex Crime and Policy Topic
Including all 3 origins “sex crime and...
asked 19 minutes ago -
6. What volume will 40.0mL of nitrogen, measured at 15.0°C and
780.0torr, occupy at STP?
7....
asked 19 minutes ago -
Scientists have meaured that at a distance of 1 AU from star X
energy of radiation...
asked 30 minutes ago -
Q4 #4
How far apart are an object and an image formed by a
89-cm-focal-length converging...
asked 36 minutes ago