
-2 0 Theoretical Quantiles T-Test Réplican Mean Std Dev Median Min Max Range Skew Kurtosis AD p value 1 10 1238 2408 214 641415 1195 3229 0731 0037 10 0.711 1529 0.383 0829 4370 5199 1327 4357568 104 0418 1.214 .3923023 1.358 4.381 068932828 0598 10 0,087 166 09 20581390 3448 0592 2218 0351 0393 5 10 0.189 1590444 3137 2449032642 0211 0801 6 10 0.522 0130.455 0563 1452 201516 259 062 7 10 0462 1.039.343 1828 1313 314 0502019 290036 0 0.86-1.844|1.576 3.420 -0994 2597- 0773 ーー110-10.451 1.14 9 10 02241.470 0.511 1.227 2.658 3.885 0474 1.561 0.7390.036 0.413 -6.422 2.337 8.7591.9656.159 1.134 0.003 4n n109 2.474
Homework Answers
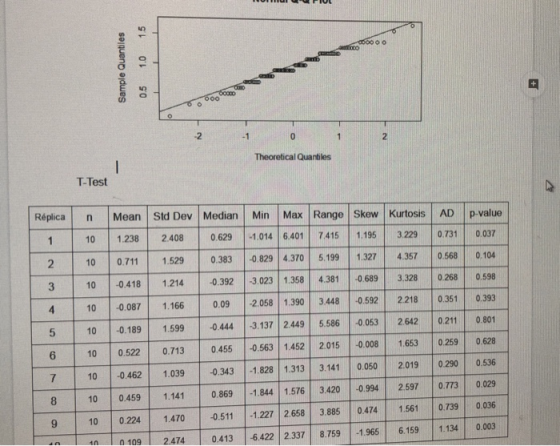
Repeat the below procedure for 10 times to get the desired result
set.seed(1)
#data = rpois(n=300,lambda = 0.8)
data = rt(n=50,df=2)
head(data)
sortedData = sort(data)
head(sortedData)
i = 1:length(data)
f_cum = (i-0.5)/length(data) # Here is the error in your
program
theo_quantiles =
qnorm(p=f_cum,mean=mean(data),sd=sd(data))
sample_quantiles = sortedData
head(plot(x=sample_quantiles,y=theo_quantiles,main = "Normal
Probability Plot",
xlab = "Sample Quantiles", ylab = "Theoritical Quantilies"))
abline(lm(theo_quantiles~sample_quantiles))
qqnorm(data)
qqline(data)
install.packages("nortest")
install.packages("moments")
library(nortest)
ADT <- ad.test(data)
pvalue <- ADT$p.value
p.value <- zapsmall(pvalue)
AD <- ADT$statistic
library(moments)
Mean <- mean(data)
Std.Dev <- sd(data)
Median <- median(data)
Min <- min(data)
Max <- max(data)
Range <- Max - Min
Skew <- skewness(data)
Kurtosis <- kurtosis(data)
n <- 50
summary_data <-
cbind(n,Mean,Std.Dev,Median,Min,Max,Range,Skew,Kurtosis,AD,p.value)
summary_data
Add Answer to:
what code in R should I use if I want to achieve 10 different outputs with the same n. n= a number that doesnt satisfies the CLT my distributions are pois(0.8) and t(2) the one I used is below but...
Most questions answered within 3 hours.
-
Evaluate a specific listening situation using the Sapir-Whorf
and Bernstein hypothesis. What was thecontext? What was...
asked 5 minutes ago -
Recall that if X is a Student’s t random variable with n df,
then by definition...
asked 23 minutes ago -
A charge of -2.95 µC is fixed in place. From a horizontal
distance of 0.0470 m,...
asked 20 minutes ago -
Consider the following information:
Your company makes widgets. You are trying to figure out what
volume...
asked 22 minutes ago -
Math 333 Plz help ASAP
The yield of a chemical process is being studied. From previous...
asked 38 minutes ago -
Cobb-Douglas Preferences: Cobb-Douglas preferences on the
consump-
tion set R2+ can be represented by a utility...
asked 34 minutes ago -
In your experience, what are some of the barriers to the
successful implementation of a project?...
asked 37 minutes ago -
1. A normal distribution has a mean of
μ = 60 and a standard deviation
of...
asked 39 minutes ago -
The size of your Social Security benefits is determined by:
(select all that apply) Question 1...
asked 52 minutes ago -
Starch polymers are broken down by enzymes into monomers
called:
a.)maltose
b.) dextrins
c.) glucose
d.)...
asked 58 minutes ago -
How does HA (High Availability) work and name two ways it can
help an organization?
asked 1 hour ago -
Saginaw Company is a garden products wholesale firm. In
December, Saginaw Company expects to sell 26,000...
asked 1 hour ago