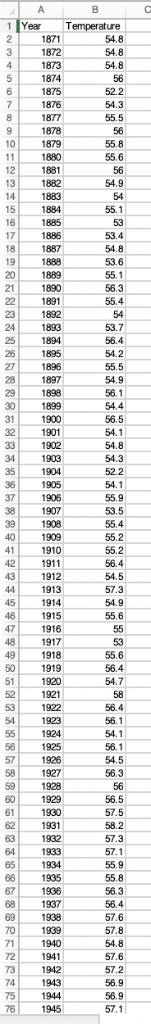
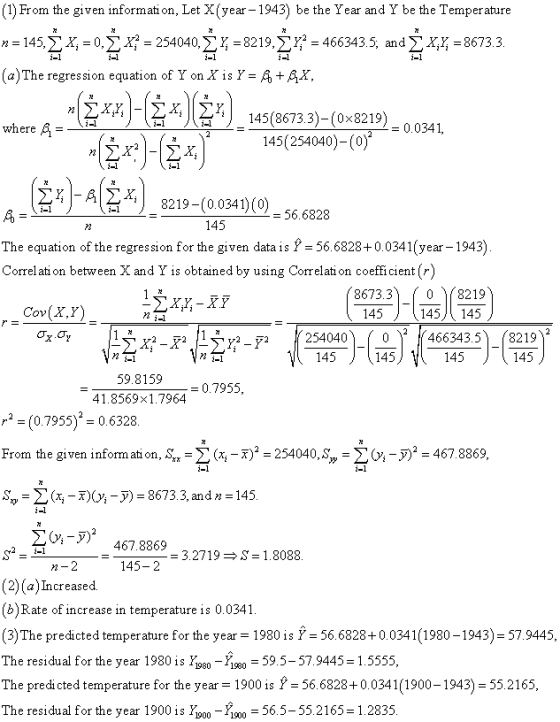
Question 1: Compute the linear regression equation (coefficients) between the “year” variable and the “temperature” variable. In other words, the dependent variable will be the temperature and the independent variable will be “year” variable. Write down the equation, the correlation coefficient R and the standard error.
Question 2.
a. Has the annual temperature trend given by the regression line increased or decreased? Hint: Which of the regression line coefficients expresses whether the linear relationship between temperature and time (in years) is increasing or decreasing?
b. What is the rate of increase or decrease in temperature? Hint: the rate of increase or decrease in temperature is the amount of change in temperature for a change of 1 year. Write down that amount.
Question 3: What is the predicted temperature (by the regression equation) and the residual for year = 1980 and year =1900?

76 100 102 103 0 122 123 124 125 126 127 129 132 133 134 135 136 137 143 144 145
Homework Answers
Add Answer to:
Question 1: Compute the linear regression equation (coefficients) between the “year” variable and the “temperature” variable. In other words, the dependent variable will be the temperature and the ind...
Consider the below matrixA, which you can copy and paste directly into Matlab.
Problem #1: Consider the below matrix A, which you can copy and paste directly into Matlab. The matrix contains 3 columns. The first column consists of Test #1 marks, the second column is Test # 2 marks, and the third column is final exam marks for a large linear algebra course. Each row represents a particular student.A = [36 45 75 81 59 73 77 73 73 65 72 78 65 55 83 73 57 78 84 31 60 83...
Problem 8.4: Refer to Muscle Mass Problem 1.27. Second-order regression model (8.2) with independent normal error...
Problem 8.4: Refer to Muscle Mass Problem 1.27. Second-order regression model (8.2) with independent normal error terms is expected to be appropriate. A. Fit regression model (8.2). Plot the fitted regression function and the data. Does the quadratic regression function appear to be a good fit here? Find R^2. B. Test whether or not there is regression relation; use α= .05. State the alternatives, decision rule and conclusion. C. Estimate the mean muscle mass for women aged 48...
Determine the number of carbons on the molecule using the mas spectra 43 100 90 80 70 60 50 40 30 39 20 10 74 27 m/z Values and Intensities: 161 38 351 39 21기 40 401 41 6781 42 5781 43 9861 44 45 3...
 Determine the number of carbons on the molecule using the mas
spectra
43 100 90 80 70 60 50 40 30 39 20 10 74 27 m/z Values and Intensities: 161 38 351 39 21기 40 401 41 6781 42 5781 43 9861 44 45 311 46 Trl 50 101 51 이 52 리 53 1기 54 쾨 55 811 56 691 57 601 58 61 59 411 60 T 71 T1 72 Trl 73 74 16275 253 17 54...
Determine the number of carbons on the molecule using the mas
spectra
43 100 90 80 70 60 50 40 30 39 20 10 74 27 m/z Values and Intensities: 161 38 351 39 21기 40 401 41 6781 42 5781 43 9861 44 45 311 46 Trl 50 101 51 이 52 리 53 1기 54 쾨 55 811 56 691 57 601 58 61 59 411 60 T 71 T1 72 Trl 73 74 16275 253 17 54...
1. Forecast demand for Year 4. a. Explain what technique you utilized to forecast your demand....
 1. Forecast demand for Year 4.
a. Explain what technique you utilized to forecast your
demand.
b. Explain why you chose this technique over others.
Year 3 Year 1 Year 2 Actual Actual Actual Forecast Forecast Forecast Demand Demand Demand Week 1 52 57 63 55 66 77 Week 2 49 58 68 69 75 65 Week 3 47 50 58 65 80 74 Week 4 60 53 58 55 78 67 57 Week 5 49 57 64 76 77...
1. Forecast demand for Year 4.
a. Explain what technique you utilized to forecast your
demand.
b. Explain why you chose this technique over others.
Year 3 Year 1 Year 2 Actual Actual Actual Forecast Forecast Forecast Demand Demand Demand Week 1 52 57 63 55 66 77 Week 2 49 58 68 69 75 65 Week 3 47 50 58 65 80 74 Week 4 60 53 58 55 78 67 57 Week 5 49 57 64 76 77...
Use the accompanying data set on the pulse rates (in beats per minute) of males to...
Use the accompanying data set on the pulse rates (in beats per minute) of males to complete parts (a) and (b) below. LOADING... Click the icon to view the pulse rates of males. a. Find the mean and standard deviation, and verify that the pulse rates have a distribution that is roughly normal. The mean of the pulse rates is 71.871.8 beats per minute. (Round to one decimal place as needed.) The standard deviation of the pulse rates is 12.212.2...
Problem 4: Variables that may affect Grades The data set contains a random sample of STAT 250 Final Exam Scores out of 80 points. For each individual sampled, the time (in hours per week) that the stu...
Problem 4: Variables that may affect Grades The data set contains a random sample of STAT 250 Final Exam Scores out of 80 points. For each individual sampled, the time (in hours per week) that the student spent participating in a GMU club or sport and working for pay outside of GMU was recorded. Values of 0 indicate the students either does not participate in a club or sport or does not work a job for pay. The goal of...
With the multiple linear regression equation in (2), what will be the alumni-giving rate with the...
 With the multiple linear regression equation in (2), what will
be the alumni-giving rate with the graduation rate as 85%, 60% of
classes with fewer than 20 students, and student-faculty ratio as
12? (20%).
State Graduation Rate 85 79 93 85 75 Alumni Giving Rate 25 % of Classes Student-Faculty Under 20 Ratio 39 13 68 8 60 8 33 40 65 3 10 46 28 67 72 52 8 31 89 90 45 69 72 12 7 13 10...
With the multiple linear regression equation in (2), what will
be the alumni-giving rate with the graduation rate as 85%, 60% of
classes with fewer than 20 students, and student-faculty ratio as
12? (20%).
State Graduation Rate 85 79 93 85 75 Alumni Giving Rate 25 % of Classes Student-Faculty Under 20 Ratio 39 13 68 8 60 8 33 40 65 3 10 46 28 67 72 52 8 31 89 90 45 69 72 12 7 13 10...
Question 1 15 pts Test scores for a class of 40 students are listed below: 25...
 Question 1 15 pts Test scores for a class of 40 students are listed below: 25 35 43 44 47 48 54 55 56 57 59 62 63 65 66 68 69 69 71 72 72 73 74 76 77 77 78 79 80 81 81 82 83 85 89 92 93 94 97 98 a) The mean of the sample data is b) The median of the sample data is c) The standard deviation of the sample data is...
Answer Question 3 (16) (a) ANOVA output: 3 points (b) Null and alternative hypotheses in term...
answer Question 3 (16) (a) ANOVA output: 3 points (b) Null and alternative hypotheses in terms of the population means: 3 points Pooled estimate of the common variance: 2 points Value of the test statistic: 2 points Null distribution: 2 points The P-value: 2 points Conclusion in plain language: 2 points the following is the data use stat crunch or excel Category code score C 1 45 C 1 53 C 1 72 C 1 55 C 1 67 C...
For each variable of interest, do the following: 1. Find the mean, five-number summary, range, variance,...
For each variable of interest, do the following: 1. Find the mean, five-number summary, range, variance, and standard deviation. Display these numbers in a format that is easy to understand. 2. For each variable of interest, use its five-number summary to construct a boxplot. Each boxplot must be constructed horizontally, and must be accompanied by a brief descriptive paragraph that assesses whether the data appear to be symmetrical, left-skewed, or right-skewed. Construct a 95% confidence interval for the mean μ...
 Determine the number of carbons on the molecule using the mas
spectra
43 100 90 80 70 60 50 40 30 39 20 10 74 27 m/z Values and Intensities: 161 38 351 39 21기 40 401 41 6781 42 5781 43 9861 44 45 311 46 Trl 50 101 51 이 52 리 53 1기 54 쾨 55 811 56 691 57 601 58 61 59 411 60 T 71 T1 72 Trl 73 74 16275 253 17 54...
Determine the number of carbons on the molecule using the mas
spectra
43 100 90 80 70 60 50 40 30 39 20 10 74 27 m/z Values and Intensities: 161 38 351 39 21기 40 401 41 6781 42 5781 43 9861 44 45 311 46 Trl 50 101 51 이 52 리 53 1기 54 쾨 55 811 56 691 57 601 58 61 59 411 60 T 71 T1 72 Trl 73 74 16275 253 17 54...
 1. Forecast demand for Year 4.
a. Explain what technique you utilized to forecast your
demand.
b. Explain why you chose this technique over others.
Year 3 Year 1 Year 2 Actual Actual Actual Forecast Forecast Forecast Demand Demand Demand Week 1 52 57 63 55 66 77 Week 2 49 58 68 69 75 65 Week 3 47 50 58 65 80 74 Week 4 60 53 58 55 78 67 57 Week 5 49 57 64 76 77...
1. Forecast demand for Year 4.
a. Explain what technique you utilized to forecast your
demand.
b. Explain why you chose this technique over others.
Year 3 Year 1 Year 2 Actual Actual Actual Forecast Forecast Forecast Demand Demand Demand Week 1 52 57 63 55 66 77 Week 2 49 58 68 69 75 65 Week 3 47 50 58 65 80 74 Week 4 60 53 58 55 78 67 57 Week 5 49 57 64 76 77...
 With the multiple linear regression equation in (2), what will
be the alumni-giving rate with the graduation rate as 85%, 60% of
classes with fewer than 20 students, and student-faculty ratio as
12? (20%).
State Graduation Rate 85 79 93 85 75 Alumni Giving Rate 25 % of Classes Student-Faculty Under 20 Ratio 39 13 68 8 60 8 33 40 65 3 10 46 28 67 72 52 8 31 89 90 45 69 72 12 7 13 10...
With the multiple linear regression equation in (2), what will
be the alumni-giving rate with the graduation rate as 85%, 60% of
classes with fewer than 20 students, and student-faculty ratio as
12? (20%).
State Graduation Rate 85 79 93 85 75 Alumni Giving Rate 25 % of Classes Student-Faculty Under 20 Ratio 39 13 68 8 60 8 33 40 65 3 10 46 28 67 72 52 8 31 89 90 45 69 72 12 7 13 10...
 Question 1 15 pts Test scores for a class of 40 students are listed below: 25 35 43 44 47 48 54 55 56 57 59 62 63 65 66 68 69 69 71 72 72 73 74 76 77 77 78 79 80 81 81 82 83 85 89 92 93 94 97 98 a) The mean of the sample data is b) The median of the sample data is c) The standard deviation of the sample data is...
Most questions answered within 3 hours.
-
A coach uses a new technique to train gymnasts. Seven
gymnasts were randomly selected and their...
asked 46 minutes ago -
While rotating the tires on your car you notice a rock [mass =
0.1 Kg] stuck...
asked 2 hours ago -
Using MARS simulator, write MIPS programs according to
the following scenarios: Receive a positive integer number...
asked 4 hours ago -
An object in front of a concave mirror has a real image that is
11.5 cm...
asked 4 hours ago -
Consider the reaction, C3 H8 + O2 --> CO2 + H2O. How many
moles of O2...
asked 6 hours ago -
You and your opponent both roll a fair die. If you both roll the
same number,...
asked 6 hours ago -
In a study of the accuracy of fast food drive-through orders,
Restaurant A had 257 accurate...
asked 6 hours ago -
Identify and describe in detail the four categories of
institutions that could be included in a...
asked 6 hours ago -
In python
class Customer:
def __init__(self, customer_id, last_name, first_name, phone_number, address):
self._customer_id = int(customer_id)
self._last_name =...
asked 7 hours ago -
What is an example of a limitation in implementing a new
ERP system and how it...
asked 7 hours ago -
In a section of 9.7cm of an artery with a radius of 2.6mm there
is a...
asked 7 hours ago -
the two carboxylic acid groups of aspartic acid have different
acidities with pKa values of 2.1...
asked 7 hours ago