Consider the following Time Series.
Homework Answers
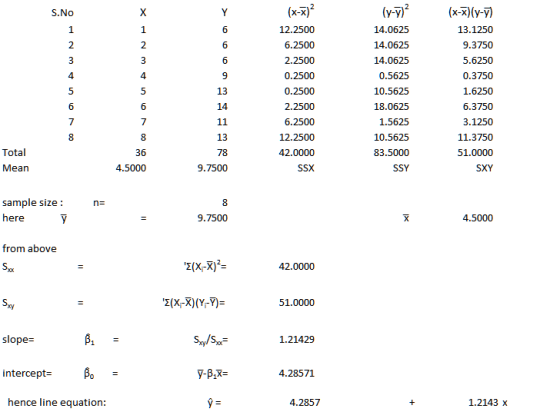
a)
forecast for period 9 =4.2857+1.2143*9=15.214
b)
from above:
| et=|y-ŷ| |
| 0.50 |
| 0.71 |
| 1.93 |
| 0.14 |
| 2.64 |
| 2.43 |
| 1.79 |
| 1.00 |
average of above =MAD =1.3929
Add Answer to:
Consider the following Time Series. Consider the following time series. eri Demand 66 6 9 13 14 1 13 a) Using a trend projection, forecast the demand for Period 9. b) Calculate the MAD for this forec...
Respond to each of the items using the following time series data. Period 1 2 3...
 Respond to each of the items using the following time series data. Period 1 2 3 4 5 6 7 8 9 10 11 12 13 14 15 16 Demand 144 172 157 160 144 181 160 176 149 183 182 149 153 164 153 104 Click here for the Excel Data File b. Compute all possible forecasts using a five-period moving average. (Round your answers to 1 decimal place.) Period Demand 5-period SMA Absolute Errors 1 144 2 172...
Consider the following time series data. t 1 ය 6 11 2 4 5 Y 9...
 Consider the following time series data. t 1 ය 6 11 2 4 5 Y 9 13 15 a. Which of the following is a correct time series plot for this data? 1. TimeSeries Value 14 -12 10 te 16 -4 F2 3 Time Period/t) 2. TimeSeries Value +14 +12 10 18 6 -4 1 3 Time Period (t) 3. TimeSeries Value F14 +12 10 18 6 -4 2 2 Time Period (t) - Select your answer. What type of...
Consider the following time series data. t 1 2 3 4 5 Yt 6 12 9...
Consider the following time series data. t 1 2 3 4 5 Yt 6 12 9 14 16 a. Which of the following is a correct time series plot for this data? time series plot #1 time series plot #2 time series plot #3 1. 2. 3. What type of pattern exists in the data? linear trend curvilinear trend horizontal b. Develop the linear trend equation for this time series (to 1 decimal). Tt = ___ + ____t c. What...
Consider the following time series data. 15 13 10 12 a. Which of the following is a correct time series plot for this data? TimeSeries Value 14 12 10 TimePeriod (t) TimeSeries Value 14 12 10 TimePeri...
 Consider the following time series data. 15 13 10 12 a. Which of the following is a correct time series plot for this data? TimeSeries Value 14 12 10 TimePeriod (t) TimeSeries Value 14 12 10 TimePeriod(t) TimeSeries Value 14 12 10 TimePeriod (t) 2 TimePeriod(t) select your answer- What type of pattern exists in the data? -select your answer b. Develop the linear trend equation for this time series (to 1 decimal). Tt = c. What is the forecast...
Calculate MAD and fill out table for the forecast: A forecasting method resulted in the following forecasts shown by the data in the following table a) Use the data to calculate the MAD for this fore...
 Calculate MAD and fill out table for the forecast:
A forecasting method resulted in the following forecasts shown by the data in the following table a) Use the data to calculate the MAD for this forecast. Use the regression equation (given below) to forecast demand for period 11. And calculate the MAD for this regression method Is the regression method preferred over the method used? Why or why not? b) c) PeriodDemand Forecast A-F 54 48 68 36 68 45...
Calculate MAD and fill out table for the forecast:
A forecasting method resulted in the following forecasts shown by the data in the following table a) Use the data to calculate the MAD for this forecast. Use the regression equation (given below) to forecast demand for period 11. And calculate the MAD for this regression method Is the regression method preferred over the method used? Why or why not? b) c) PeriodDemand Forecast A-F 54 48 68 36 68 45...
In Excel, create a forecast for periods 6-13 using the following method: 5 period simple moving...
In Excel, create a forecast for periods 6-13 using the following method: 5 period simple moving average. Using a 5 period simple moving average, the forecast for period 13 will be: Period Data 1 45 2 52 3 48 4 59 5 55 6 55 7 64 8 58 9 73 10 66 11 69 12 74
2. Consider the following time series data: 2Month Value 20 15 23 6 4 13 6 18 25 10 8 10 9 24 12 10 21 13 19 14 15...
 2. Consider the following time series data: 2Month Value 20 15 23 6 4 13 6 18 25 10 8 10 9 24 12 10 21 13 19 14 15 la. Use a α # 0.25 to compute the exponential smoothing values for the time series. Compute MSE and a forecast for Month 12. b. Compare the two-month moving average forecast with the exponential smoothing forecast using a 0.25. Which appears to 17 provide the better forecast based on MSE?...
Given the series of demand data below Period: 1 2 3 4 5 6 7 8...
Given the series of demand data below Period: 1 2 3 4 5 6 7 8 9 10 Demand: 45 35 51 43 22 50 36 38 26 37 a. Calculate the forecasts for periods 7 through 11 using moving average models with n = 2, n = 4, and n = 6. Week n=2 n=4 n=6 7 8 9 10 11 b. Calculate the bias and MAD for each set of forecasts. (Negative answers should be indicated by a...
Consider the following time series data 4 10 13 15 a. Which of the following is...
 Consider the following time series data 4 10 13 15 a. Which of the following is a correct time series plot for this data? TimeSeries Value 14 12 10 4 2 TimePeriod(t) TimeSeries Value 14 12 10 4 2 TimePeriod(t) TimeSeries Value 14 7つ TimeSeries Value 14 12 10 8 TimePeriod(t) 3. TimeSeries Value 14 12 10 TimePeriod (t -Select your answer+ What type of pattern exists in the data? -Select your answer- b. Develop the linear trend equation for...
Omework Consider the following time series data Month 1 2 3 4 5 6 7 Value 21 14 18 13 18 21 14 a....
 omework Consider the following time series data Month 1 2 3 4 5 6 7 Value 21 14 18 13 18 21 14 a. Which of the following is a correct time series plot for this data? や" -Select your answer- What type of pattern exists in the data? -select your answer- b. Develop the three-month moving average forecasts for this time series. Compute MSE and a forecast for month 8 (to 2 decimals if necessary). Enter negative values as...
 Respond to each of the items using the following time series data. Period 1 2 3 4 5 6 7 8 9 10 11 12 13 14 15 16 Demand 144 172 157 160 144 181 160 176 149 183 182 149 153 164 153 104 Click here for the Excel Data File b. Compute all possible forecasts using a five-period moving average. (Round your answers to 1 decimal place.) Period Demand 5-period SMA Absolute Errors 1 144 2 172...
 Consider the following time series data. t 1 ය 6 11 2 4 5 Y 9 13 15 a. Which of the following is a correct time series plot for this data? 1. TimeSeries Value 14 -12 10 te 16 -4 F2 3 Time Period/t) 2. TimeSeries Value +14 +12 10 18 6 -4 1 3 Time Period (t) 3. TimeSeries Value F14 +12 10 18 6 -4 2 2 Time Period (t) - Select your answer. What type of...
 Consider the following time series data. 15 13 10 12 a. Which of the following is a correct time series plot for this data? TimeSeries Value 14 12 10 TimePeriod (t) TimeSeries Value 14 12 10 TimePeriod(t) TimeSeries Value 14 12 10 TimePeriod (t) 2 TimePeriod(t) select your answer- What type of pattern exists in the data? -select your answer b. Develop the linear trend equation for this time series (to 1 decimal). Tt = c. What is the forecast...
 Calculate MAD and fill out table for the forecast:
A forecasting method resulted in the following forecasts shown by the data in the following table a) Use the data to calculate the MAD for this forecast. Use the regression equation (given below) to forecast demand for period 11. And calculate the MAD for this regression method Is the regression method preferred over the method used? Why or why not? b) c) PeriodDemand Forecast A-F 54 48 68 36 68 45...
Calculate MAD and fill out table for the forecast:
A forecasting method resulted in the following forecasts shown by the data in the following table a) Use the data to calculate the MAD for this forecast. Use the regression equation (given below) to forecast demand for period 11. And calculate the MAD for this regression method Is the regression method preferred over the method used? Why or why not? b) c) PeriodDemand Forecast A-F 54 48 68 36 68 45...
 2. Consider the following time series data: 2Month Value 20 15 23 6 4 13 6 18 25 10 8 10 9 24 12 10 21 13 19 14 15 la. Use a α # 0.25 to compute the exponential smoothing values for the time series. Compute MSE and a forecast for Month 12. b. Compare the two-month moving average forecast with the exponential smoothing forecast using a 0.25. Which appears to 17 provide the better forecast based on MSE?...
 Consider the following time series data 4 10 13 15 a. Which of the following is a correct time series plot for this data? TimeSeries Value 14 12 10 4 2 TimePeriod(t) TimeSeries Value 14 12 10 4 2 TimePeriod(t) TimeSeries Value 14 7つ TimeSeries Value 14 12 10 8 TimePeriod(t) 3. TimeSeries Value 14 12 10 TimePeriod (t -Select your answer+ What type of pattern exists in the data? -Select your answer- b. Develop the linear trend equation for...
 omework Consider the following time series data Month 1 2 3 4 5 6 7 Value 21 14 18 13 18 21 14 a. Which of the following is a correct time series plot for this data? や" -Select your answer- What type of pattern exists in the data? -select your answer- b. Develop the three-month moving average forecasts for this time series. Compute MSE and a forecast for month 8 (to 2 decimals if necessary). Enter negative values as...
Most questions answered within 3 hours.
-
Write the ionic equations for the first stage of salts
hydrolysis.
Anion, Cation?
Na2S
NiSO4
K2SO4...
asked 11 minutes ago -
suppose there is a normally distributed population with a mean of
250 and a standard deviation...
asked 54 minutes ago -
Question Three
Suppose you as project manager are using the Waterfall
development methodology on a large...
asked 1 hour ago -
Which statement is not true about welfare in Canada?
A.Benefits typically vary based on one's ability...
asked 2 hours ago -
Please help me with FLOWCHART and UML diagram for class,
thank you!
#include <iostream>
#include <fstream>...
asked 3 hours ago -
3. Describe the “logic circuit” of the Lac operon. Which
proteins are bound or not to...
asked 3 hours ago -
Ayesha’s adjusted gross income is $60,000 in 2019. She donated a
piece of artwork with a...
asked 3 hours ago -
For Dijkstra’s shortest path algorithm:
a. Give the Big-O time for Dijkstra’s shortest path algorithm
and...
asked 3 hours ago -
Phosphorus violates the 'octet rule' in biological molecules,
forming more covalent bonds than expected based on...
asked 3 hours ago -
A 1.3 eV electron has a 10-4 probability of tunneling
through a 2.4 eV potential barrier....
asked 3 hours ago -
What is the one ingredient that is common to being successful
with all stakeholders?
profit
trust...
asked 3 hours ago -
Write an assembly language 32 bit program that reads in lines of
text by a .txt...
asked 3 hours ago