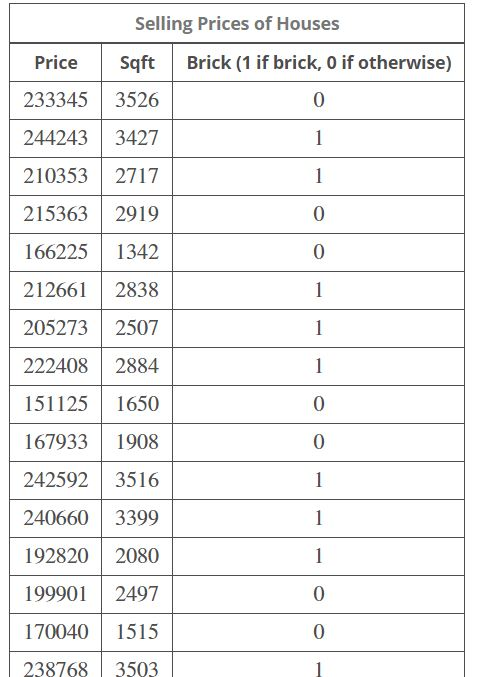
Suppose the following data were collected relating the selling price of a house to square footage and whether or not the house is made out of brick. Use statistical software to find the regression equation. Is there enough evidence to support the claim that on average brick houses are more expensive than other types of houses at the 0.05 level of significance? If yes, type the regression equation in the spaces provided with answers rounded to two decimal places. Else, select "There is not enough evidence."
I could not get the entire table in 1 picture so I took 2 pictures

These are the numbers from the 2nd picture in case they are too small
| 226069 | 3263 | 0 |
| 186387 | 2258 | 0 |
| 204800 | 2495 | 1 |
| 214960 | 2772 | 0 |
226069 3263 186387 2258 204800 2495 214960 2772 0 0 0 EEB Tables Answer How to enter your answer Selecting a checkbox will replace the entered answer value(s) with the checkbox value. If the checkbox is not selected, the entered answer is used PRICE SQFT+ BRICK e There is not enough evidence
Homework Answers
Solution:
Here, we have to develop a regression model for the prediction of the dependent variable price based on the independent variables sqft and Brick. The required regression model by using excel is given as below:
|
Regression Statistics |
||||||
|
Multiple R |
0.977198575 |
|||||
|
R Square |
0.954917055 |
|||||
|
Adjusted R Square |
0.949613179 |
|||||
|
Standard Error |
6228.160973 |
|||||
|
Observations |
20 |
|||||
|
ANOVA |
||||||
|
df |
SS |
MS |
F |
Significance F |
||
|
Regression |
2 |
13967605236 |
6983802618 |
180.0413658 |
3.6233E-12 |
|
|
Residual |
17 |
659429814.7 |
38789989.1 |
|||
|
Total |
19 |
14627035050 |
||||
|
Coefficients |
Standard Error |
t Stat |
P-value |
Lower 95% |
Upper 95% |
|
|
Intercept |
106558.0743 |
5751.587409 |
18.52672432 |
1.0411E-12 |
94423.28574 |
118692.8629 |
|
Sqft |
36.60749499 |
2.28493242 |
16.02125939 |
1.08392E-11 |
31.78670902 |
41.42828096 |
|
Brick |
7398.155862 |
3076.330574 |
2.404863744 |
0.027851055 |
907.6657545 |
13888.64597 |
The p-value for this regression model is given as 3.6233E-12 ≈ 0.00 which is less than alpha value 0.05, so we reject the null hypothesis. There is sufficient evidence to conclude that the given regression model is statistically significant for the prediction of the dependent variable price.
The required regression equation is given as below:
PRICEi = 106558.07 + 36.61*SQFTi + 7398.16*BRICKi + ei
Add Answer to:
Suppose the following data were collected relating the selling price of a house to square footage and whether or not the house is made out of brick. Use statistical software to find the regression equ...
Suppose the following data were collected relating the selling price of a house to square footage...
 Suppose the following data were collected relating the selling
price of a house to square footage and whether or not the house is
made out of wood. Use statistical software to find the regression
equation. Is there enough evidence to support the claim that on
average wood houses are more expensive than other types of houses
at the 0.01 level of significance? If yes, type the regression
equation in the spaces provided with answers rounded to two decimal
places. Else,...
Suppose the following data were collected relating the selling
price of a house to square footage and whether or not the house is
made out of wood. Use statistical software to find the regression
equation. Is there enough evidence to support the claim that on
average wood houses are more expensive than other types of houses
at the 0.01 level of significance? If yes, type the regression
equation in the spaces provided with answers rounded to two decimal
places. Else,...
Suppose the following data were collected from a sample of 15 CEOs relating annual salary to...
 Suppose the following data were collected from a sample of 15
CEOs relating annual salary to years of experience and the economic
sector their company belongs to. Use statistical software to find
the following regression equation:
SALARYi=b0+b1EXPERIENCEi+b2SERVICEi+b3INDUSTRIALi+ei .
Is there enough evidence to support the claim that on average,
CEOs in the industrial sector have lower salaries than CEOs in the
financial sector at the 0.05 level of significance?
If yes, write the regression equation in the spaces provided
with...
Suppose the following data were collected from a sample of 15
CEOs relating annual salary to years of experience and the economic
sector their company belongs to. Use statistical software to find
the following regression equation:
SALARYi=b0+b1EXPERIENCEi+b2SERVICEi+b3INDUSTRIALi+ei .
Is there enough evidence to support the claim that on average,
CEOs in the industrial sector have lower salaries than CEOs in the
financial sector at the 0.05 level of significance?
If yes, write the regression equation in the spaces provided
with...
1/11 Question 2 of 10, Step 1 of 1 Correct Suppose the following data were collected...
 1/11 Question 2 of 10, Step 1 of 1 Correct Suppose the following data were collected from a sample of 5 car manufacturers relating monthly car sales to the number of dealerships and the quarter of the year. Use statistical software to find the following regression equation bo+b DEALERSHIPS, + bQUARTERI, + byQUARTER2, +b,QUARTER3, + e SALES, Is there enough evidence to support the claim that on average, car sales are higher in the 4th quarter than in the 1st...
 Suppose the following data were collected relating the selling
price of a house to square footage and whether or not the house is
made out of wood. Use statistical software to find the regression
equation. Is there enough evidence to support the claim that on
average wood houses are more expensive than other types of houses
at the 0.01 level of significance? If yes, type the regression
equation in the spaces provided with answers rounded to two decimal
places. Else,...
Suppose the following data were collected relating the selling
price of a house to square footage and whether or not the house is
made out of wood. Use statistical software to find the regression
equation. Is there enough evidence to support the claim that on
average wood houses are more expensive than other types of houses
at the 0.01 level of significance? If yes, type the regression
equation in the spaces provided with answers rounded to two decimal
places. Else,...
 Suppose the following data were collected from a sample of 15
CEOs relating annual salary to years of experience and the economic
sector their company belongs to. Use statistical software to find
the following regression equation:
SALARYi=b0+b1EXPERIENCEi+b2SERVICEi+b3INDUSTRIALi+ei .
Is there enough evidence to support the claim that on average,
CEOs in the industrial sector have lower salaries than CEOs in the
financial sector at the 0.05 level of significance?
If yes, write the regression equation in the spaces provided
with...
Suppose the following data were collected from a sample of 15
CEOs relating annual salary to years of experience and the economic
sector their company belongs to. Use statistical software to find
the following regression equation:
SALARYi=b0+b1EXPERIENCEi+b2SERVICEi+b3INDUSTRIALi+ei .
Is there enough evidence to support the claim that on average,
CEOs in the industrial sector have lower salaries than CEOs in the
financial sector at the 0.05 level of significance?
If yes, write the regression equation in the spaces provided
with...
 1/11 Question 2 of 10, Step 1 of 1 Correct Suppose the following data were collected from a sample of 5 car manufacturers relating monthly car sales to the number of dealerships and the quarter of the year. Use statistical software to find the following regression equation bo+b DEALERSHIPS, + bQUARTERI, + byQUARTER2, +b,QUARTER3, + e SALES, Is there enough evidence to support the claim that on average, car sales are higher in the 4th quarter than in the 1st...
Most questions answered within 3 hours.
-
In
l-cell disease, an enzyme in the endomembrane system that normally
adds phosphorylated sugar groups to...
asked 15 seconds from now -
What is the difference between windows and Linux with regard to
address space and processor support.
asked 7 minutes ago -
Lucy Lampkin wants to purchase a bond with a face value of
$7,000 and a bond...
asked 22 minutes ago -
What types of problems has the internet helped you to solve?
From the topics listed below,...
asked 29 minutes ago -
Consider the force table setup where a 200g mass is hung at
300º. To cancel this...
asked 44 minutes ago -
A circular loop of radius 100 mm is placed in a magnetic field
of magnitude 0.052...
asked 36 minutes ago -
How to write a bash shell script that prints a hollow box after
user enters number...
asked 50 minutes ago -
During the fermentation process for brewing beer, the brewing
container (called a fermentor) is purposely not...
asked 1 hour ago -
Suppose you do 6J of work to stretch a certain spring from its
equilibrium length to...
asked 1 hour ago -
Symmetric encryption
is also known as:
Public key
cryptography
Secret key
cryptography
The single sign-on
mechanism...
asked 1 hour ago -
Draw a full mechanism for the formation of the dihydropyridine
structure from a generic aldehyde!
asked 1 hour ago -
ch. 19 #2
A battery with an emf of 12.0 V shows a terminal voltage of...
asked 1 hour ago