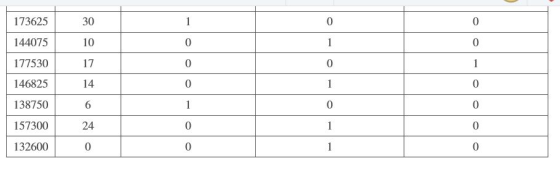
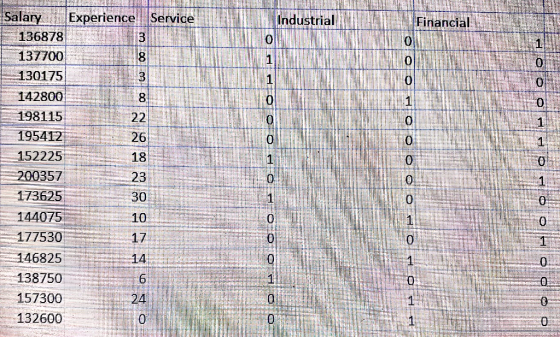
Suppose the following data were collected from a sample of 15 CEOs relating annual salary to years of experience and the economic sector their company belongs to. Use statistical software to find the following regression equation: SALARYi=b0+b1EXPERIENCEi+b2SERVICEi+b3INDUSTRIALi+ei .
Is there enough evidence to support the claim that on average, CEOs in the industrial sector have lower salaries than CEOs in the financial sector at the 0.05 level of significance?
If yes, write the regression equation in the spaces provided with answers rounded to two decimal places. Else, select "There is not enough evidence."


Homework Answers


Add Answer to:
Suppose the following data were collected from a sample of 15
CEOs relating annual salary to...
Suppose the following data were collected from a sample of 15 CEOs relating annual salary to...
Suppose the following data were collected from a sample of 15 CEOs relating annual salary to years of experience and the economic sector their company belongs to. Which of the following is the best equation to use relating salary to experience and business sector? CEO Salaries Salary Experience Service (1 if service sector, 0 otherwise) Industrial (1 if industrial sector, 0 otherwise) Financial (1 if financial sector, 0 otherwise) 154800154800 2020 11 00 00 151462151462 1717 00 11 00 190295190295...
Suppose the following data were collected relating the selling price of a house to square footage...
 Suppose the following data were collected relating the selling
price of a house to square footage and whether or not the house is
made out of wood. Use statistical software to find the regression
equation. Is there enough evidence to support the claim that on
average wood houses are more expensive than other types of houses
at the 0.01 level of significance? If yes, type the regression
equation in the spaces provided with answers rounded to two decimal
places. Else,...
Suppose the following data were collected relating the selling
price of a house to square footage and whether or not the house is
made out of wood. Use statistical software to find the regression
equation. Is there enough evidence to support the claim that on
average wood houses are more expensive than other types of houses
at the 0.01 level of significance? If yes, type the regression
equation in the spaces provided with answers rounded to two decimal
places. Else,...
Suppose the following data were collected relating the selling price of a house to square footage and whether or not the house is made out of brick. Use statistical software to find the regression equ...
 Suppose the following data were collected relating the selling
price of a house to square footage and whether or not the house is
made out of brick. Use statistical software to find the regression
equation. Is there enough evidence to support the claim that on
average brick houses are more expensive than other types of houses
at the 0.05 level of significance? If yes, type the regression
equation in the spaces provided with answers rounded to two decimal
places. Else,...
Suppose the following data were collected relating the selling
price of a house to square footage and whether or not the house is
made out of brick. Use statistical software to find the regression
equation. Is there enough evidence to support the claim that on
average brick houses are more expensive than other types of houses
at the 0.05 level of significance? If yes, type the regression
equation in the spaces provided with answers rounded to two decimal
places. Else,...
1/11 Question 2 of 10, Step 1 of 1 Correct Suppose the following data were collected...
 1/11 Question 2 of 10, Step 1 of 1 Correct Suppose the following data were collected from a sample of 5 car manufacturers relating monthly car sales to the number of dealerships and the quarter of the year. Use statistical software to find the following regression equation bo+b DEALERSHIPS, + bQUARTERI, + byQUARTER2, +b,QUARTER3, + e SALES, Is there enough evidence to support the claim that on average, car sales are higher in the 4th quarter than in the 1st...
Suppose the following table was generated from the sample data of 20 teachers relating annual salary...
 Suppose the following table was generated from the sample data of 20 teachers relating annual salary to months of teaching experience and gender. Coefficients Standard Error t Stat P-Value 7985.439824 304.553861 124.724867 0.000000 6.958001 11.888299 0.000000 Male (1 If male, 0 if female) 1420.439875 218.999146 6.486052 0.000006 Intercept 82.718798 Months of Experience Step 1 of 2: In this regression equation, what is the intercept value for women? Enter your answer in the space provided. Do not round your answer. 2...
please help thank you! Selling Information For Real Estate Value Price SqFt Brick (1 if brick,...
 please help thank you!
Selling Information For Real Estate Value Price SqFt Brick (1 if brick, if othewise) $241,255 3,392 0 $184,518 2,038 1 $176,488 1,906 0 $240,068 3,329 0 $169,760 1,828 0 $185,335 2,081 0 $172,735 1, 9260 $224,281 3,4250 $172,589 1,676 1 $214,635 2,735 1 $199,666 2,373 1 $208,348 2,662 1 $218,360 2, 8341 $230,160 3, 2540 $164,812 1,431 0 $191,560 1,839 1 $203,255 2, 4561 $173,325 1,530 $168,073 1.381 1 $179,620 1,4571 TABLE 4 Industrial CEO Salary...
please help thank you!
Selling Information For Real Estate Value Price SqFt Brick (1 if brick, if othewise) $241,255 3,392 0 $184,518 2,038 1 $176,488 1,906 0 $240,068 3,329 0 $169,760 1,828 0 $185,335 2,081 0 $172,735 1, 9260 $224,281 3,4250 $172,589 1,676 1 $214,635 2,735 1 $199,666 2,373 1 $208,348 2,662 1 $218,360 2, 8341 $230,160 3, 2540 $164,812 1,431 0 $191,560 1,839 1 $203,255 2, 4561 $173,325 1,530 $168,073 1.381 1 $179,620 1,4571 TABLE 4 Industrial CEO Salary...
Suppose the following table was generated from the sample data of 2020 employees relating annual salary...
Suppose the following table was generated from the sample data of 2020 employees relating annual salary to years of education and gender. According to the results, is there a salary difference between men and women at the 0.050.05 level of significance? If yes, write the difference in salary in the space provided, rounded to two decimal places. Else, select "There is not enough evidence." Coefficients Standard Error t Stat P-Value Intercept −8619.401339−8619.401339 3672.4312293672.431229 −2.347056−2.347056 0.0312940.031294 Education 3622.7871453622.787145 231.963588231.963588 15.61791315.617913 0.0000000.000000...
Suppose the following table was generated from sample data of 20 20 employees relating hourly wage to years of experience and whether or not they have a college degree. Using statistical software, cre...
Suppose the following table was generated from sample data of 20 20 employees relating hourly wage to years of experience and whether or not they have a college degree. Using statistical software, create an indicator (dummy) variable for the variable "Degree" and find the regression equation. Is there enough evidence to support the claim that on average employees with a college degree have higher hourly wages than those without a college degree at the 0.05 0.05 level of significance? If...
The following data was collected to explore how the average number of hours a student studies...
 The following data was collected to explore how the average number of hours a student studies per night and the student's PA affect their ACT score. The dependent variable is the ACT score, the first independent variable (ri) is the number of hours spent studying and the second independent variable (x2) is the student's GPA Effects on ACT Scores Study Hours GPA ACT Score 24 21 19 17 Copy Data Step 1 of 2: Find the p-value for the regression...
Question 1 of 9. Step 2 of 2 1/16 Correct The following data was collected to...
 Question 1 of 9. Step 2 of 2 1/16 Correct The following data was collected to explore how a students age and GPA affect the number of parking tickets they receive in a given year The dependent variable is the number of parking sekets. the first independent variable in is the students age, and the second Independent variable() is the student's GPA Effects on Number of Parking Tickets GPA Number of Tickets Copy Data Step 2 of 2: Determine if...
 Suppose the following data were collected relating the selling
price of a house to square footage and whether or not the house is
made out of wood. Use statistical software to find the regression
equation. Is there enough evidence to support the claim that on
average wood houses are more expensive than other types of houses
at the 0.01 level of significance? If yes, type the regression
equation in the spaces provided with answers rounded to two decimal
places. Else,...
Suppose the following data were collected relating the selling
price of a house to square footage and whether or not the house is
made out of wood. Use statistical software to find the regression
equation. Is there enough evidence to support the claim that on
average wood houses are more expensive than other types of houses
at the 0.01 level of significance? If yes, type the regression
equation in the spaces provided with answers rounded to two decimal
places. Else,...
 Suppose the following data were collected relating the selling
price of a house to square footage and whether or not the house is
made out of brick. Use statistical software to find the regression
equation. Is there enough evidence to support the claim that on
average brick houses are more expensive than other types of houses
at the 0.05 level of significance? If yes, type the regression
equation in the spaces provided with answers rounded to two decimal
places. Else,...
Suppose the following data were collected relating the selling
price of a house to square footage and whether or not the house is
made out of brick. Use statistical software to find the regression
equation. Is there enough evidence to support the claim that on
average brick houses are more expensive than other types of houses
at the 0.05 level of significance? If yes, type the regression
equation in the spaces provided with answers rounded to two decimal
places. Else,...
 1/11 Question 2 of 10, Step 1 of 1 Correct Suppose the following data were collected from a sample of 5 car manufacturers relating monthly car sales to the number of dealerships and the quarter of the year. Use statistical software to find the following regression equation bo+b DEALERSHIPS, + bQUARTERI, + byQUARTER2, +b,QUARTER3, + e SALES, Is there enough evidence to support the claim that on average, car sales are higher in the 4th quarter than in the 1st...
 Suppose the following table was generated from the sample data of 20 teachers relating annual salary to months of teaching experience and gender. Coefficients Standard Error t Stat P-Value 7985.439824 304.553861 124.724867 0.000000 6.958001 11.888299 0.000000 Male (1 If male, 0 if female) 1420.439875 218.999146 6.486052 0.000006 Intercept 82.718798 Months of Experience Step 1 of 2: In this regression equation, what is the intercept value for women? Enter your answer in the space provided. Do not round your answer. 2...
 please help thank you!
Selling Information For Real Estate Value Price SqFt Brick (1 if brick, if othewise) $241,255 3,392 0 $184,518 2,038 1 $176,488 1,906 0 $240,068 3,329 0 $169,760 1,828 0 $185,335 2,081 0 $172,735 1, 9260 $224,281 3,4250 $172,589 1,676 1 $214,635 2,735 1 $199,666 2,373 1 $208,348 2,662 1 $218,360 2, 8341 $230,160 3, 2540 $164,812 1,431 0 $191,560 1,839 1 $203,255 2, 4561 $173,325 1,530 $168,073 1.381 1 $179,620 1,4571 TABLE 4 Industrial CEO Salary...
please help thank you!
Selling Information For Real Estate Value Price SqFt Brick (1 if brick, if othewise) $241,255 3,392 0 $184,518 2,038 1 $176,488 1,906 0 $240,068 3,329 0 $169,760 1,828 0 $185,335 2,081 0 $172,735 1, 9260 $224,281 3,4250 $172,589 1,676 1 $214,635 2,735 1 $199,666 2,373 1 $208,348 2,662 1 $218,360 2, 8341 $230,160 3, 2540 $164,812 1,431 0 $191,560 1,839 1 $203,255 2, 4561 $173,325 1,530 $168,073 1.381 1 $179,620 1,4571 TABLE 4 Industrial CEO Salary...
 The following data was collected to explore how the average number of hours a student studies per night and the student's PA affect their ACT score. The dependent variable is the ACT score, the first independent variable (ri) is the number of hours spent studying and the second independent variable (x2) is the student's GPA Effects on ACT Scores Study Hours GPA ACT Score 24 21 19 17 Copy Data Step 1 of 2: Find the p-value for the regression...
 Question 1 of 9. Step 2 of 2 1/16 Correct The following data was collected to explore how a students age and GPA affect the number of parking tickets they receive in a given year The dependent variable is the number of parking sekets. the first independent variable in is the students age, and the second Independent variable() is the student's GPA Effects on Number of Parking Tickets GPA Number of Tickets Copy Data Step 2 of 2: Determine if...
Most questions answered within 3 hours.
-
You have a yeast cell culture with a concentration of 5x10^4
cells/ml. If you dilute this...
asked 2 minutes ago -
In which direction the Reaction goes? Show detailed process.
SeO3 + 2ClO2. + 2H3O <---> Se...
asked 15 minutes ago -
Unexposed silver halides are removed from photographic film when
they react with sodium thiosulfate
(Na2S2O3, called...
asked 15 minutes ago -
A 0.3054 gram sample of the mineral chalcopyrite (CuFeS2)
yielded 0.6525 gram BaSO4 precipitate. What is...
asked 15 minutes ago -
An short-seller in Tesla is worried the latest management
earnings forecast is too aggressive and the...
asked 1 hour ago -
Question 3 (1 point)
Fill in the blank. Speed Car Rental company found that the tire...
asked 1 hour ago -
1. A copper wire is 26.61 cm long and weighs 1.265 g. The
density of copper...
asked 39 minutes ago -
Remember that a concept sketch consists of a sketch (or
series of sketches), labels, and complete...
asked 42 minutes ago -
on a newly discovered planet, the period of a pendulum with a
length of 2 m...
asked 44 minutes ago -
Why [M(CN)6] is not organometallic even it has metal
to carbon bond too
asked 50 minutes ago -
mstar electric has a bond issue outstanding that has a 20 year
life, a $1,000 par...
asked 57 minutes ago -
This is a Business Writing Question:
Common Types of Faulty Sentence Logic:
A. Mixed constructions
B....
asked 58 minutes ago