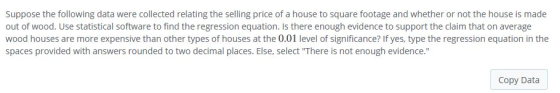
Suppose the following data were collected relating the selling price of a house to square footage and whether or not the house is made out of wood. Use statistical software to find the regression equation. Is there enough evidence to support the claim that on average wood houses are more expensive than other types of houses at the 0.01 level of significance? If yes, type the regression equation in the spaces provided with answers rounded to two decimal places. Else, select "There is not enough evidence."


Homework Answers
We will perform regression analysis in R-Studio. We will check the following hypothesis:
Ho: Wood houses are not more expensive than other types of houses i.e Coefficient <= 0
Ha: The coefficient of wood is significantly greater than zero
Run the following code in R:
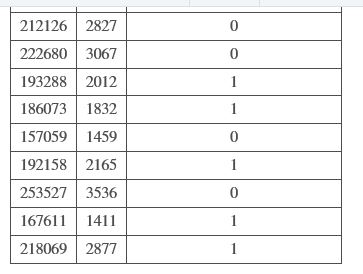
Price = c(202811,228434,196739,211351,156012,196376,157448,199109,230693,223887,192221,212126,222680,193288,186073,157059,192158,253527,167611,218069)
> Sqft=c(2402,3413,2414,2761,1718,2304,1425,2477,3320,3046,2353,2827,3067,2012,1832,1459,2165,3536,1411,2877)
> Wood = c(1,1,0,1,0,1,0,0,1,0,0,0,0,1,1,0,1,0,1,1)
> Model = lm(Price~Sqft+Wood)
> summary(Model)
The results are:
Call:
lm(formula = Price ~ Sqft + Wood)

Residuals:
     Min       1Q   Median       3Q      Max
-13477.8  -1956.4     45.4   2249.0  13804.2

Coefficients:
             Estimate Std. Error t value Pr(>|t|)
(Intercept) 1.031e+05  5.799e+03  17.784 2.02e-12
Sqft        3.863e+01  2.232e+00  17.311 3.13e-12
Wood        4.930e+03  2.885e+03   1.709    0.106

(Intercept) ***
Sqft        ***
Wood
---
Signif. codes:
0 ‘***’ 0.001 ‘**’ 0.01 ‘*’ 0.05 ‘.’ 0.1 ‘ ’ 1

Residual standard error: 6451 on 17 degrees of freedom
Multiple R-squared:  0.9469,    Adjusted R-squared:  0.9407
F-statistic: 151.7 on 2 and 17 DF,  p-value: 1.446e-11
We can see that the coefficient of wood has a p-value of 0.106 which means that it is not significant at 0.01 level of significance. Hence, we cannot reject the null hypothesis
Correct answer: Not enough evidence
Add Answer to:
Suppose the following data were collected relating the selling
price of a house to square footage...
Suppose the following data were collected relating the selling price of a house to square footage and whether or not the house is made out of brick. Use statistical software to find the regression equ...
 Suppose the following data were collected relating the selling
price of a house to square footage and whether or not the house is
made out of brick. Use statistical software to find the regression
equation. Is there enough evidence to support the claim that on
average brick houses are more expensive than other types of houses
at the 0.05 level of significance? If yes, type the regression
equation in the spaces provided with answers rounded to two decimal
places. Else,...
Suppose the following data were collected relating the selling
price of a house to square footage and whether or not the house is
made out of brick. Use statistical software to find the regression
equation. Is there enough evidence to support the claim that on
average brick houses are more expensive than other types of houses
at the 0.05 level of significance? If yes, type the regression
equation in the spaces provided with answers rounded to two decimal
places. Else,...
Suppose the following data were collected from a sample of 15 CEOs relating annual salary to...
 Suppose the following data were collected from a sample of 15
CEOs relating annual salary to years of experience and the economic
sector their company belongs to. Use statistical software to find
the following regression equation:
SALARYi=b0+b1EXPERIENCEi+b2SERVICEi+b3INDUSTRIALi+ei .
Is there enough evidence to support the claim that on average,
CEOs in the industrial sector have lower salaries than CEOs in the
financial sector at the 0.05 level of significance?
If yes, write the regression equation in the spaces provided
with...
Suppose the following data were collected from a sample of 15
CEOs relating annual salary to years of experience and the economic
sector their company belongs to. Use statistical software to find
the following regression equation:
SALARYi=b0+b1EXPERIENCEi+b2SERVICEi+b3INDUSTRIALi+ei .
Is there enough evidence to support the claim that on average,
CEOs in the industrial sector have lower salaries than CEOs in the
financial sector at the 0.05 level of significance?
If yes, write the regression equation in the spaces provided
with...
A real estate analyst estimates the following regression, relating a house price to its square footage...
A real estate analyst estimates the following regression, relating a house price to its square footage (Sqft): PriceˆPrice^ = 48.11 + 52.06Sqft; SSE = 56,244; n = 50 In an attempt to improve the results, he adds two more explanatory variables: the number of bedrooms (Beds) and the number of bathrooms (Baths). The estimated regression equation is PriceˆPrice^ = 28.82 + 40.84Sqft + 10.34Beds + 16.65Baths; SSE = 48,681; n = 50 Calculate the value of the test statistic. (Round...
please help thank you! Selling Information For Real Estate Value Price SqFt Brick (1 if brick,...
 please help thank you!
Selling Information For Real Estate Value Price SqFt Brick (1 if brick, if othewise) $241,255 3,392 0 $184,518 2,038 1 $176,488 1,906 0 $240,068 3,329 0 $169,760 1,828 0 $185,335 2,081 0 $172,735 1, 9260 $224,281 3,4250 $172,589 1,676 1 $214,635 2,735 1 $199,666 2,373 1 $208,348 2,662 1 $218,360 2, 8341 $230,160 3, 2540 $164,812 1,431 0 $191,560 1,839 1 $203,255 2, 4561 $173,325 1,530 $168,073 1.381 1 $179,620 1,4571 TABLE 4 Industrial CEO Salary...
please help thank you!
Selling Information For Real Estate Value Price SqFt Brick (1 if brick, if othewise) $241,255 3,392 0 $184,518 2,038 1 $176,488 1,906 0 $240,068 3,329 0 $169,760 1,828 0 $185,335 2,081 0 $172,735 1, 9260 $224,281 3,4250 $172,589 1,676 1 $214,635 2,735 1 $199,666 2,373 1 $208,348 2,662 1 $218,360 2, 8341 $230,160 3, 2540 $164,812 1,431 0 $191,560 1,839 1 $203,255 2, 4561 $173,325 1,530 $168,073 1.381 1 $179,620 1,4571 TABLE 4 Industrial CEO Salary...
1/11 Question 2 of 10, Step 1 of 1 Correct Suppose the following data were collected...
 1/11 Question 2 of 10, Step 1 of 1 Correct Suppose the following data were collected from a sample of 5 car manufacturers relating monthly car sales to the number of dealerships and the quarter of the year. Use statistical software to find the following regression equation bo+b DEALERSHIPS, + bQUARTERI, + byQUARTER2, +b,QUARTER3, + e SALES, Is there enough evidence to support the claim that on average, car sales are higher in the 4th quarter than in the 1st...
Solve 4-23 Please 4-22 The following data give the selling price, square footage, number of bedrooms,...
 Solve 4-23 Please
4-22 The following data give the selling price, square footage, number of bedrooms, and age of houses that have sold in a neighborhood in the past 6 months. Develop three regression models to predict the selling price based upon each of the other factors individually. Which of these is best? SELLING PRICE (S) SQUARE FOOTAGE BEDROOMS AGE (YEARS) 84,000 1,670 79,000 1,339 91,500 1,712 120,000 1,840 127.500 2,300 132.500 2,234 145.000 2,311 164.000 2,377 155,000 2,736 168,000...
Solve 4-23 Please
4-22 The following data give the selling price, square footage, number of bedrooms, and age of houses that have sold in a neighborhood in the past 6 months. Develop three regression models to predict the selling price based upon each of the other factors individually. Which of these is best? SELLING PRICE (S) SQUARE FOOTAGE BEDROOMS AGE (YEARS) 84,000 1,670 79,000 1,339 91,500 1,712 120,000 1,840 127.500 2,300 132.500 2,234 145.000 2,311 164.000 2,377 155,000 2,736 168,000...
One of the biggest factors in determining the value of a home is the square footage....
One of the biggest factors in determining the value of a home is the square footage. The accompanying data represent the square footage and selling price (in thousands ofdollars) for a random sample of homes for sale in a certain region. Complete all parts below (A.) Which variable is the explanatory variable? a. selling price b. square footage Square Footage, x Selling Price ($000s), y 2221 382.7 3046 353.4 1175 197.2 1938 332.2 3166 630.2 2857 383.9 4086 623.6...
Excel Problem 2 - Chapter 12: PART B: The following data give the selling price, square...
Excel Problem 2 - Chapter 12: PART B: The following data give the selling price, square footage, and age of houses that have sold in a Bend, OR in the past 6 months (note that this is the same base data as Part A, above, with new variables added). Selling Price ($) Square Footage Age (Years) 84,000 1,670 30 79,000 1,339 25 91,500 1,712 30 120,000 1,840 40 127,500 2,300 18 132,500 2,234 30 145,000 2,311 19 164,000 2,377 7...
House Selling Price Data for 100 homes relating y = selling price (in dollars) to x...
House Selling Price Data for 100 homes relating y = selling price (in dollars) to x = size of the house (in square feet) results in the regression line that is shown below. y= 9161 + 77.008x the slope estimate has standard error 6.262 Show all steps of a two-sided significance test of independence. Could the sample association between these two variables by explained by random variation? a) Assumptions b) Hypotheses: c) Test Statistics: d) p-value: e) Conclusion:
A Realtor is interested in modeling the selling price of houses based on the square footage, the ...
 A Realtor is interested in modeling the selling price of houses based on the square footage, the age of the house, and the style. The data was collected in the two largest cities in Arkansas and is presented in an excel file. We need two indicator variables for the style of the house. I will choose Traditional as the base category lif the house is a rambler lif the house is victorian rambler Oif not Now use Minitab output to...
 Suppose the following data were collected relating the selling
price of a house to square footage and whether or not the house is
made out of brick. Use statistical software to find the regression
equation. Is there enough evidence to support the claim that on
average brick houses are more expensive than other types of houses
at the 0.05 level of significance? If yes, type the regression
equation in the spaces provided with answers rounded to two decimal
places. Else,...
Suppose the following data were collected relating the selling
price of a house to square footage and whether or not the house is
made out of brick. Use statistical software to find the regression
equation. Is there enough evidence to support the claim that on
average brick houses are more expensive than other types of houses
at the 0.05 level of significance? If yes, type the regression
equation in the spaces provided with answers rounded to two decimal
places. Else,...
 Suppose the following data were collected from a sample of 15
CEOs relating annual salary to years of experience and the economic
sector their company belongs to. Use statistical software to find
the following regression equation:
SALARYi=b0+b1EXPERIENCEi+b2SERVICEi+b3INDUSTRIALi+ei .
Is there enough evidence to support the claim that on average,
CEOs in the industrial sector have lower salaries than CEOs in the
financial sector at the 0.05 level of significance?
If yes, write the regression equation in the spaces provided
with...
Suppose the following data were collected from a sample of 15
CEOs relating annual salary to years of experience and the economic
sector their company belongs to. Use statistical software to find
the following regression equation:
SALARYi=b0+b1EXPERIENCEi+b2SERVICEi+b3INDUSTRIALi+ei .
Is there enough evidence to support the claim that on average,
CEOs in the industrial sector have lower salaries than CEOs in the
financial sector at the 0.05 level of significance?
If yes, write the regression equation in the spaces provided
with...
 please help thank you!
Selling Information For Real Estate Value Price SqFt Brick (1 if brick, if othewise) $241,255 3,392 0 $184,518 2,038 1 $176,488 1,906 0 $240,068 3,329 0 $169,760 1,828 0 $185,335 2,081 0 $172,735 1, 9260 $224,281 3,4250 $172,589 1,676 1 $214,635 2,735 1 $199,666 2,373 1 $208,348 2,662 1 $218,360 2, 8341 $230,160 3, 2540 $164,812 1,431 0 $191,560 1,839 1 $203,255 2, 4561 $173,325 1,530 $168,073 1.381 1 $179,620 1,4571 TABLE 4 Industrial CEO Salary...
please help thank you!
Selling Information For Real Estate Value Price SqFt Brick (1 if brick, if othewise) $241,255 3,392 0 $184,518 2,038 1 $176,488 1,906 0 $240,068 3,329 0 $169,760 1,828 0 $185,335 2,081 0 $172,735 1, 9260 $224,281 3,4250 $172,589 1,676 1 $214,635 2,735 1 $199,666 2,373 1 $208,348 2,662 1 $218,360 2, 8341 $230,160 3, 2540 $164,812 1,431 0 $191,560 1,839 1 $203,255 2, 4561 $173,325 1,530 $168,073 1.381 1 $179,620 1,4571 TABLE 4 Industrial CEO Salary...
 1/11 Question 2 of 10, Step 1 of 1 Correct Suppose the following data were collected from a sample of 5 car manufacturers relating monthly car sales to the number of dealerships and the quarter of the year. Use statistical software to find the following regression equation bo+b DEALERSHIPS, + bQUARTERI, + byQUARTER2, +b,QUARTER3, + e SALES, Is there enough evidence to support the claim that on average, car sales are higher in the 4th quarter than in the 1st...
 Solve 4-23 Please
4-22 The following data give the selling price, square footage, number of bedrooms, and age of houses that have sold in a neighborhood in the past 6 months. Develop three regression models to predict the selling price based upon each of the other factors individually. Which of these is best? SELLING PRICE (S) SQUARE FOOTAGE BEDROOMS AGE (YEARS) 84,000 1,670 79,000 1,339 91,500 1,712 120,000 1,840 127.500 2,300 132.500 2,234 145.000 2,311 164.000 2,377 155,000 2,736 168,000...
Solve 4-23 Please
4-22 The following data give the selling price, square footage, number of bedrooms, and age of houses that have sold in a neighborhood in the past 6 months. Develop three regression models to predict the selling price based upon each of the other factors individually. Which of these is best? SELLING PRICE (S) SQUARE FOOTAGE BEDROOMS AGE (YEARS) 84,000 1,670 79,000 1,339 91,500 1,712 120,000 1,840 127.500 2,300 132.500 2,234 145.000 2,311 164.000 2,377 155,000 2,736 168,000...
 A Realtor is interested in modeling the selling price of houses based on the square footage, the age of the house, and the style. The data was collected in the two largest cities in Arkansas and is presented in an excel file. We need two indicator variables for the style of the house. I will choose Traditional as the base category lif the house is a rambler lif the house is victorian rambler Oif not Now use Minitab output to...
Most questions answered within 3 hours.
-
can someone please write the balanced chemical
equation for the synthesis of Bromoacetanilide
from;
aniline +...
asked 1 minute ago -
(Ratio Analysis): Last year Co. XYZ had sales of $ 400,000, with
“cost of goods sold”...
asked 4 minutes ago -
1. If a corporation purchases land and building and subsequently
tears down the building and uses...
asked 12 minutes ago -
Consider a 23-year bond with 7 percent annual coupon payments.
The market rate (YTM) is 6.4...
asked 15 minutes ago -
a tuba creates a 4th harmonic of frequency 116.5 Hz. what is the
frequency of the...
asked 21 minutes ago -
A coconut mass 2kg falls from a 30m tall tree. The coconut falls
and comes to...
asked 24 minutes ago -
Group Policies
Research GROUP POLICY OBJECTS (GPO'S)
You can start in the Windows Server 2012 eBook...
asked 28 minutes ago -
software engineering
Problems.
Create a use case diagram for class registration for a
university.
Create a...
asked 28 minutes ago -
You are trying to convince your friend who wants to attend
medical school to take BY123...
asked 43 minutes ago -
Subject: C++
I have created a class called QueueOfIntegers in a file called
QueueOfIntegers.h, which is...
asked 43 minutes ago -
calculate the number of molecules of gas in a
container of 2.0 liter at 30 degrees...
asked 1 hour ago -
1.which of the following is a phototroph?
a. sulfolobus
b. chloroflexus
c. bacteroidetes
d. deinococcus radioduran...
asked 56 minutes ago