
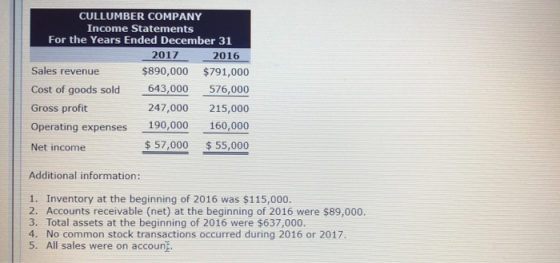


CULLUMBER COMPANY Income Statements For the Years Ended December 31 2017 2016 Sales revenue Cost of goods sold Gross profit $890,000 $791,000 643,000 576,000 247,000 215,000 Operating expenses 190,000 160,000 Net income $57,000 $55,000 Additional information: 1. Inventory at the beginning of 2016 was $115,000. 2. Accounts receivable (net) at the beginning of 2016 were $89,000. 3. Total assets at the beginning of 2016 were $637,000. 4. No common stock transactions occurred during 2016 or 2017 5. All sales were on accoun..
Compute the liquidity and profitability ratios of Cullumber Company for 2016 and 2017. (Round all answers to 2 decima negative, e.g.-1.83%) or (1.83%).) 2016 2017 % Change LIQUIDITY Current ratio 2.01 :1 8.7 times 4.1 times 1.76:1 -12)% Accounts receivables turnover 9.1 times 4 Inventory turnover 3.2 times 2016 % Change 2017 PROFITABILITY Profit margin Asset turnover times times Return on assets 2.68 2.78 Earnings per share s
Given below are three independent situations and a ratio that may be affected. For each situsation, compute the affected ratio (1) as of December 31, 2017, and (2) as of Decernber 31, 2018, after c to the situation. (Round all answers to 2 decinal places, ea 1.83 or 1 ar% " %。hange is a decrease show the numbers as negative, ea, rare or 1.83% 1. 20,000 shares of common stock were sold at par on Jully 1, 2018. Net income for 2018 was $52,000. 2. All of the notes payable were paid n 2018. All other liabates remained at ther December 3, 2017 levels Total assets on December 31, 2018. re ses,00· Dett to assets ratio 3. The market price of common stock was $9 and $12 on December 31, 2017 and 2018, respectively Price -earnings ratico Return on common stockholders' equity Debt to assets ratio Price earnings ratio
Homework Answers
Accounts Receivable Turnover = Net credit sales / Average
Accounts Receivables
Inventory Turnover = COGS / Average Inventory
Profit Margin = Net Income / Net Sales x 100
Assets Turnover = Net Sales / Average Total Assets
Return on Assets = Net Income / Average Total Assets x 100
Return on common stockholders equity = Net Income / Average Common
stockholders Equity x 100
Debt to Assets Ratio = Total Liabilities / Total Assets
Price Earning Ratio = Price / EPS
EPS = Net Income / No. of shares outstanding
Average = (Opening Value + Closing Value) / 2
| 2016 | 2017 | |||
| Average Accounts Receivable | $ 90,500.00 | $ 97,500.00 | ||
| Accounts Receivable Turnover | 8.74 | 9.13 | 0.39 | 4% |
| Average Inventory | $ 1,39,500.00 | $ 2,01,500.00 | ||
| Inventory Turnover | 4.13 | 3.19 | -0.94 | -23% |
| Profit Margin | 0.07 | 0.06 | -0.01 | -8% |
| Average Total Assets | $ 6,76,000.00 | $ 7,99,500.00 | ||
| Assets Turnover | 1.17 | 1.11 | -0.06 | -5% |
| Return on Assets | 0.08 | 0.07 | -0.01 | -12% |
b.
| 2017 | 2018 | |
| Notes Payable | $ 1,70,000.00 | $ - |
| Accounts Payable | $ 66,000.00 | $ 66,000.00 |
| Accrued Liabilities | $ 42,000.00 | $ 42,000.00 |
| Bonds Payable | $ 2,51,000.00 | $ 2,51,000.00 |
| Total Liabilities | $ 5,29,000.00 | $ 3,59,000.00 |
| Common Stock | $ 2,05,000.00 | $ 4,05,000.00 |
| Retained Earnings | $ 1,50,000.00 | $ 95,000.00 |
| Total Common Stockholders Equity | $ 3,55,000.00 | $ 5,00,000.00 |
| Total Liabilities & stockholders Equity | $ 8,84,000.00 | $ 8,59,000.00 |
Since Income for the year 2018 given is $52000, Retained
earnings at end would have been $150000+$52000 i.e. $202000
But Total assets value is given to be $859000, therefore difference
of $107000 is treated as dividend paid.
| 2017 | 2018 | |||
| Average Stockholders Equity | $ 3,51,500.00 | $ 4,27,500.00 | ||
| Return on common stockholders equity | 16.22% | 12.16% | -0.04 | -25% |
| Debt to Assets ratio | 0.60 | 0.42 | ||
| EPS | $ 2.78 | $ 1.28 | -1.50 | -54% |
| P/E Ratio | 3.24 | 9.38 | 6.14 | 190% |
Add Answer to:
CULLUMBER COMPANY Balance Sheets December 31 Assets Cash Debt investments (short-term) Accounts receivable Inventory Prepaid expenses Land Building and equipment (net) Total assets Liabilities...
The following financial information is for Cullumber Company. upport CULLUMBER COMPANY Balance Sheets December 31 Assets...
 The following financial information is for Cullumber Company. upport CULLUMBER COMPANY Balance Sheets December 31 Assets 2017 2016 Cash Debt investments (short-term) Accounts receivable Inventory $ 72,000 $68,000 51,000 42,000 109,000 92,000 237,000 169,000 28,000 25,000 131,000 131,000 259,000 186,000 $887,000 $713,000 Prepaid expenses Land Building and equipment (net) Total assets Liabilities and Stockholders' Equity Notes payable $169,000 $109,000 69,000 50,000 Accounts payable Accrued liabilities Bonds payable, due 2017 Common stock, $10 par 41,000 41,000 252,000 170,000 209,000 209,000 147,000...
The following financial information is for Oriole Company. ORIOLE COMPANY Balance Sheets December 31 Assets 2017...
 The following financial information is for Oriole Company.
ORIOLE COMPANY
Balance Sheets
December 31
Assets
2017
2016
Cash
$ 70,000
$ 69,000
Debt investments (short-term)
51,000
40,000
Accounts receivable
107,000
92,000
Inventory
234,000
167,000
Prepaid expenses
26,000
23,000
Land
135,000
135,000
Building and equipment (net)
261,000
184,000
Total assets
$884,000
$710,000
Liabilities and Stockholders’ Equity
Notes payable
$172,000
$106,000
Accounts payable
66,000
52,000
Accrued liabilities
42,000
42,000
Bonds payable, due 2020
251,000
170,000
Common stock, $10 par
204,000
204,000
Retained...
The following financial information is for Oriole Company.
ORIOLE COMPANY
Balance Sheets
December 31
Assets
2017
2016
Cash
$ 70,000
$ 69,000
Debt investments (short-term)
51,000
40,000
Accounts receivable
107,000
92,000
Inventory
234,000
167,000
Prepaid expenses
26,000
23,000
Land
135,000
135,000
Building and equipment (net)
261,000
184,000
Total assets
$884,000
$710,000
Liabilities and Stockholders’ Equity
Notes payable
$172,000
$106,000
Accounts payable
66,000
52,000
Accrued liabilities
42,000
42,000
Bonds payable, due 2020
251,000
170,000
Common stock, $10 par
204,000
204,000
Retained...
Problem 14-4A (Part Level Submission) Financial information for Messersmith Company is presented below MESSERSMITH COMPANY Balance Sheets December 31 Assets Cash Short-term investments Accounts recei...
 Problem 14-4A (Part Level Submission) Financial information for Messersmith Company is presented below MESSERSMITH COMPANY Balance Sheets December 31 Assets Cash Short-term investments Accounts receivable (net) Inventory Prepaid expenses Land Building and equipment (net) 2017 $92,400 68,640 129,360 165,000 38,280 171,600 237,600 $902,880 2016 $85,800 52,800 105,600 178,200 30,360 171,600 231,000 $855,360 Liabilities and Stockholders' Equit Notes payable Accounts payable Accrued liabilities Bonds payable, due 2020 Common stock, $10 par Retained earnings $132,000 55,440 52,800 198,000 264,000 153,120 $855,360 $132,000...
Balance Sheets December 31 Assets 2022 2021 $69,000 $69,000 Cash Debt investments (short-term) 51,000 105,000 39,000...
 Balance Sheets December 31 Assets 2022 2021 $69,000 $69,000 Cash Debt investments (short-term) 51,000 105,000 39,000 90,000 Accounts receivable Inventory 230,000 168,000 Prepaid expenses 24,000 26,000 Land 129,000 129,000 262,000 Building and equipment (net) 183,000 Total assets $870,000 $704,000 Liabilities and Stockholders' Equity Notes payable Accounts payable Accrued liabilities Bonds payable, due 2025 $171,000 $109,000 66,000 52,000 40,000 40,000 252,000 172,000 205,000 205,000 136,000 126,000 $870,000 $704,000 Common stock, $10 par Retained earnings Total liabilities and stockholders' equity We were...
The following financial information is for Ivanhoe Company. IVANHOE COMPANY Balance Sheets December 31 Assets 2017...
 The following financial information is for Ivanhoe Company. IVANHOE COMPANY Balance Sheets December 31 Assets 2017 2016 Cash $ 71,000 $66,000 Debt investments (short-term) Accounts receivable 52,000 110,000 233.000 25,000 40,000 91,000 165,000 27,000 Inventory Prepaid expenses Land 130,000 130,000 Building and equipment (net) 259.000 184,000 Total assets $880,000 $703,000 Liabilities and Stockholders' Equity Notes payable $171,000 $110,000 Accounts payable 68,000 53,000 Accrued liabilities Bonds payable, due 2017 39,000 249,000 207,000 146,000 39,000 169,000 207,000 125,000 Common stock, $10 par...
The following financial information is for Pharoah Company. PHAROAH COMPANY Balance Sheets December 31...
 The following financial information is for Pharoah
Company.
PHAROAH COMPANY
Balance Sheets
December 31
Assets
2017
2016
Cash
$ 72,000
$ 69,000
Debt investments (short-term)
54,000
39,000
Accounts receivable
107,000
90,000
Inventory
236,000
162,000
Prepaid expenses
30,000
27,000
Land
133,000
133,000
Building and equipment (net)
260,000
188,000
Total assets
$892,000
$708,000
Liabilities and Stockholders’ Equity
Notes payable
$170,000
$106,000
Accounts payable
65,000
54,000
Accrued liabilities
42,000
42,000
Bonds payable, due 2020
250,000
171,000
Common stock, $10 par
209,000
209,000
Retained...
The following financial information is for Pharoah
Company.
PHAROAH COMPANY
Balance Sheets
December 31
Assets
2017
2016
Cash
$ 72,000
$ 69,000
Debt investments (short-term)
54,000
39,000
Accounts receivable
107,000
90,000
Inventory
236,000
162,000
Prepaid expenses
30,000
27,000
Land
133,000
133,000
Building and equipment (net)
260,000
188,000
Total assets
$892,000
$708,000
Liabilities and Stockholders’ Equity
Notes payable
$170,000
$106,000
Accounts payable
65,000
54,000
Accrued liabilities
42,000
42,000
Bonds payable, due 2020
250,000
171,000
Common stock, $10 par
209,000
209,000
Retained...
WILDHORSE COMPANY Balance Sheets December 31 Assets Cash Debt investments (short-term) Accounts receivable Inventory 2022 2021...
 WILDHORSE COMPANY Balance Sheets December 31 Assets Cash Debt investments (short-term) Accounts receivable Inventory 2022 2021 $ 70,000 $68,000 51,000 40,000 109,000 91,000 231,000 167,000 27,000 26,000 134,000 134,000 264,000 186,000 $886,000 $712,000 Prepaid expenses Land Building and equipment (net) Total assets Liabilities and Stockholders' Equity Notes payable $171,000 $109,000 Accounts payable 67,000 53,000 Accrued liabilities 41,000 41,000 Bonds payable, due 2025 250,000 170,000 Common stock, $10 par 206,000 151,000 206,000 133,000 Retained earnings Total liabilities and stockholders' equity $886,000...
The following financial information is for Cullumber Company Cullumber Company Balance Sheets December 31 2020 2019...
 The following financial information is for Cullumber Company Cullumber Company Balance Sheets December 31 2020 2019 ASsels $ 70,000 $ 64,000 Cash Debt investments (short-term) 39,000 53,000 90,000 Accounts receivable 108,000 162,000 229,000 Inventory Prepaid expenses 25,000 30,000 130,000 Land 130,000 185,000 264,000 Building and equipment (net) $884,000 $695,000 Total assets Liabilities and Stockholders' Equity $172,000 $102,000 Notes payable 65,000 51,000 Accounts payable 41,000 41,000 Accrued liabilities 250,000 172,000 Bonds payable, due 2023 202,000 Common stock, $10 par 202,000 127,000...
The following financial information is for Priscoll Company. PRISCOLL COMPANY Balance Sheets December 31 Assets 2017...
The following financial information is for Priscoll Company. PRISCOLL COMPANY Balance Sheets December 31 Assets 2017 2016 Cash $ 70,000 $ 65,000 Debt investments (short-term) 55,000 40,000 Accounts receivable 104,000 90,000 Inventory 230,000 165,000 Prepaid expenses 25,000 23,000 Land 130,000 130,000 Building and equipment (net) 260,000 185,000 Total assets $874,000 $698,000 Liabilities and Stockholders’ Equity Notes payable $170,000 $120,000 Accounts payable 65,000 52,000 Accrued liabilities 40,000 40,000 Bonds payable, due 2017 250,000 170,000 Common stock, $10 par 200,000 200,000 Retained...
The following financial information is for Pharoah Company. PHAROAH COMPANY Balance Sheets December 31 Assets 2017...
 The following financial information is for Pharoah
Company.
PHAROAH COMPANY
Balance Sheets
December 31
Assets
2017
2016
Cash
$ 72,000
$ 69,000
Debt investments (short-term)
54,000
39,000
Accounts receivable
107,000
90,000
Inventory
236,000
162,000
Prepaid expenses
30,000
27,000
Land
133,000
133,000
Building and equipment (net)
260,000
188,000
Total assets
$892,000
$708,000
Liabilities and Stockholders’ Equity
Notes payable
$170,000
$106,000
Accounts payable
65,000
54,000
Accrued liabilities
42,000
42,000
Bonds payable, due 2020
250,000
171,000
Common stock, $10 par
209,000
209,000
Retained...
The following financial information is for Pharoah
Company.
PHAROAH COMPANY
Balance Sheets
December 31
Assets
2017
2016
Cash
$ 72,000
$ 69,000
Debt investments (short-term)
54,000
39,000
Accounts receivable
107,000
90,000
Inventory
236,000
162,000
Prepaid expenses
30,000
27,000
Land
133,000
133,000
Building and equipment (net)
260,000
188,000
Total assets
$892,000
$708,000
Liabilities and Stockholders’ Equity
Notes payable
$170,000
$106,000
Accounts payable
65,000
54,000
Accrued liabilities
42,000
42,000
Bonds payable, due 2020
250,000
171,000
Common stock, $10 par
209,000
209,000
Retained...
 The following financial information is for Cullumber Company. upport CULLUMBER COMPANY Balance Sheets December 31 Assets 2017 2016 Cash Debt investments (short-term) Accounts receivable Inventory $ 72,000 $68,000 51,000 42,000 109,000 92,000 237,000 169,000 28,000 25,000 131,000 131,000 259,000 186,000 $887,000 $713,000 Prepaid expenses Land Building and equipment (net) Total assets Liabilities and Stockholders' Equity Notes payable $169,000 $109,000 69,000 50,000 Accounts payable Accrued liabilities Bonds payable, due 2017 Common stock, $10 par 41,000 41,000 252,000 170,000 209,000 209,000 147,000...
 The following financial information is for Oriole Company.
ORIOLE COMPANY
Balance Sheets
December 31
Assets
2017
2016
Cash
$ 70,000
$ 69,000
Debt investments (short-term)
51,000
40,000
Accounts receivable
107,000
92,000
Inventory
234,000
167,000
Prepaid expenses
26,000
23,000
Land
135,000
135,000
Building and equipment (net)
261,000
184,000
Total assets
$884,000
$710,000
Liabilities and Stockholders’ Equity
Notes payable
$172,000
$106,000
Accounts payable
66,000
52,000
Accrued liabilities
42,000
42,000
Bonds payable, due 2020
251,000
170,000
Common stock, $10 par
204,000
204,000
Retained...
The following financial information is for Oriole Company.
ORIOLE COMPANY
Balance Sheets
December 31
Assets
2017
2016
Cash
$ 70,000
$ 69,000
Debt investments (short-term)
51,000
40,000
Accounts receivable
107,000
92,000
Inventory
234,000
167,000
Prepaid expenses
26,000
23,000
Land
135,000
135,000
Building and equipment (net)
261,000
184,000
Total assets
$884,000
$710,000
Liabilities and Stockholders’ Equity
Notes payable
$172,000
$106,000
Accounts payable
66,000
52,000
Accrued liabilities
42,000
42,000
Bonds payable, due 2020
251,000
170,000
Common stock, $10 par
204,000
204,000
Retained...
 Problem 14-4A (Part Level Submission) Financial information for Messersmith Company is presented below MESSERSMITH COMPANY Balance Sheets December 31 Assets Cash Short-term investments Accounts receivable (net) Inventory Prepaid expenses Land Building and equipment (net) 2017 $92,400 68,640 129,360 165,000 38,280 171,600 237,600 $902,880 2016 $85,800 52,800 105,600 178,200 30,360 171,600 231,000 $855,360 Liabilities and Stockholders' Equit Notes payable Accounts payable Accrued liabilities Bonds payable, due 2020 Common stock, $10 par Retained earnings $132,000 55,440 52,800 198,000 264,000 153,120 $855,360 $132,000...
 Balance Sheets December 31 Assets 2022 2021 $69,000 $69,000 Cash Debt investments (short-term) 51,000 105,000 39,000 90,000 Accounts receivable Inventory 230,000 168,000 Prepaid expenses 24,000 26,000 Land 129,000 129,000 262,000 Building and equipment (net) 183,000 Total assets $870,000 $704,000 Liabilities and Stockholders' Equity Notes payable Accounts payable Accrued liabilities Bonds payable, due 2025 $171,000 $109,000 66,000 52,000 40,000 40,000 252,000 172,000 205,000 205,000 136,000 126,000 $870,000 $704,000 Common stock, $10 par Retained earnings Total liabilities and stockholders' equity We were...
 The following financial information is for Ivanhoe Company. IVANHOE COMPANY Balance Sheets December 31 Assets 2017 2016 Cash $ 71,000 $66,000 Debt investments (short-term) Accounts receivable 52,000 110,000 233.000 25,000 40,000 91,000 165,000 27,000 Inventory Prepaid expenses Land 130,000 130,000 Building and equipment (net) 259.000 184,000 Total assets $880,000 $703,000 Liabilities and Stockholders' Equity Notes payable $171,000 $110,000 Accounts payable 68,000 53,000 Accrued liabilities Bonds payable, due 2017 39,000 249,000 207,000 146,000 39,000 169,000 207,000 125,000 Common stock, $10 par...
 The following financial information is for Pharoah
Company.
PHAROAH COMPANY
Balance Sheets
December 31
Assets
2017
2016
Cash
$ 72,000
$ 69,000
Debt investments (short-term)
54,000
39,000
Accounts receivable
107,000
90,000
Inventory
236,000
162,000
Prepaid expenses
30,000
27,000
Land
133,000
133,000
Building and equipment (net)
260,000
188,000
Total assets
$892,000
$708,000
Liabilities and Stockholders’ Equity
Notes payable
$170,000
$106,000
Accounts payable
65,000
54,000
Accrued liabilities
42,000
42,000
Bonds payable, due 2020
250,000
171,000
Common stock, $10 par
209,000
209,000
Retained...
The following financial information is for Pharoah
Company.
PHAROAH COMPANY
Balance Sheets
December 31
Assets
2017
2016
Cash
$ 72,000
$ 69,000
Debt investments (short-term)
54,000
39,000
Accounts receivable
107,000
90,000
Inventory
236,000
162,000
Prepaid expenses
30,000
27,000
Land
133,000
133,000
Building and equipment (net)
260,000
188,000
Total assets
$892,000
$708,000
Liabilities and Stockholders’ Equity
Notes payable
$170,000
$106,000
Accounts payable
65,000
54,000
Accrued liabilities
42,000
42,000
Bonds payable, due 2020
250,000
171,000
Common stock, $10 par
209,000
209,000
Retained...
 WILDHORSE COMPANY Balance Sheets December 31 Assets Cash Debt investments (short-term) Accounts receivable Inventory 2022 2021 $ 70,000 $68,000 51,000 40,000 109,000 91,000 231,000 167,000 27,000 26,000 134,000 134,000 264,000 186,000 $886,000 $712,000 Prepaid expenses Land Building and equipment (net) Total assets Liabilities and Stockholders' Equity Notes payable $171,000 $109,000 Accounts payable 67,000 53,000 Accrued liabilities 41,000 41,000 Bonds payable, due 2025 250,000 170,000 Common stock, $10 par 206,000 151,000 206,000 133,000 Retained earnings Total liabilities and stockholders' equity $886,000...
 The following financial information is for Cullumber Company Cullumber Company Balance Sheets December 31 2020 2019 ASsels $ 70,000 $ 64,000 Cash Debt investments (short-term) 39,000 53,000 90,000 Accounts receivable 108,000 162,000 229,000 Inventory Prepaid expenses 25,000 30,000 130,000 Land 130,000 185,000 264,000 Building and equipment (net) $884,000 $695,000 Total assets Liabilities and Stockholders' Equity $172,000 $102,000 Notes payable 65,000 51,000 Accounts payable 41,000 41,000 Accrued liabilities 250,000 172,000 Bonds payable, due 2023 202,000 Common stock, $10 par 202,000 127,000...
 The following financial information is for Pharoah
Company.
PHAROAH COMPANY
Balance Sheets
December 31
Assets
2017
2016
Cash
$ 72,000
$ 69,000
Debt investments (short-term)
54,000
39,000
Accounts receivable
107,000
90,000
Inventory
236,000
162,000
Prepaid expenses
30,000
27,000
Land
133,000
133,000
Building and equipment (net)
260,000
188,000
Total assets
$892,000
$708,000
Liabilities and Stockholders’ Equity
Notes payable
$170,000
$106,000
Accounts payable
65,000
54,000
Accrued liabilities
42,000
42,000
Bonds payable, due 2020
250,000
171,000
Common stock, $10 par
209,000
209,000
Retained...
The following financial information is for Pharoah
Company.
PHAROAH COMPANY
Balance Sheets
December 31
Assets
2017
2016
Cash
$ 72,000
$ 69,000
Debt investments (short-term)
54,000
39,000
Accounts receivable
107,000
90,000
Inventory
236,000
162,000
Prepaid expenses
30,000
27,000
Land
133,000
133,000
Building and equipment (net)
260,000
188,000
Total assets
$892,000
$708,000
Liabilities and Stockholders’ Equity
Notes payable
$170,000
$106,000
Accounts payable
65,000
54,000
Accrued liabilities
42,000
42,000
Bonds payable, due 2020
250,000
171,000
Common stock, $10 par
209,000
209,000
Retained...
Most questions answered within 3 hours.
-
A .15kg rubber ball is bounced off a wall. Before hitting the
wall, the ball moves...
asked 5 minutes ago -
A manufacturing company preparing to build a new plant is
considering three potential locations for it....
asked 7 minutes ago -
B. If compound Y has approximately the same values of solubility
in toluene as compound X,...
asked 53 minutes ago -
Oscar Inc. has inventory in Japan valued at 39,051,000 Yen one
year ago. One year ago...
asked 1 hour ago -
If Canada suffered from "fundamental disequilibrium," and its
government choose not to devalue its currency, a...
asked 1 hour ago -
4. How many input & output Key Value Pairs are passed into,
and emitted out of...
asked 1 hour ago -
Why would your heart not function well if constructed of
skeletal muscle? What is the particular...
asked 1 hour ago -
Please respond to this essay question in full essay form for
Chemistry 1102 Organic and Biochemistry:...
asked 1 hour ago -
Determine the head loss and velocity of flow in a water supply main
of 15.0 cm...
asked 1 hour ago -
A marketing executive who knowingly authorizes a shoddy
defective product to be brought to market is...
asked 1 hour ago -
Write a psudocode:
1. Define a function called authorize that takes in 2 strings,
uName, and...
asked 1 hour ago -
What Hall voltage (in mV) is produced by a 0.180 T field applied
across a 2.60...
asked 1 hour ago