
Homework Answers
Add Answer to:
Map Sapling Learning A pressure versus volume (pV) diagram is shown in the figure below for a indicate the direction of the process and the points of interest are labelled. Calculate the amount o...
A pressure versus volume (pV) is shown in the figure below........ A pressure versus volume (pV)...
 A pressure versus volume (pV) is shown in the figure
below........
A pressure versus volume (pV) diagram is shown in the figure below for a system. The arrows of the curve indicate the direction of the process and the points of interest are labelled. Calculate the amount of work done on the system from 0 2 and then for the entire curve 0-5. The values for the points in the diagram are Volume (m3) Vo-27.0 и 20.2 V217.6 V3- 14.2...
A pressure versus volume (pV) is shown in the figure
below........
A pressure versus volume (pV) diagram is shown in the figure below for a system. The arrows of the curve indicate the direction of the process and the points of interest are labelled. Calculate the amount of work done on the system from 0 2 and then for the entire curve 0-5. The values for the points in the diagram are Volume (m3) Vo-27.0 и 20.2 V217.6 V3- 14.2...
A pressure versus volume (pV) diagram is shown in the figure below for a system. The...
 A pressure versus volume (pV) diagram is shown in the figure below for a system. The arrows of the curve indicate the direction of the process and the points of interest are labelled. Calculate the amount of work done on the system from 0 - 2 and then for the entire curve 0 - 5 . The values for the points in the diagram are Volume (m3) Vo 25.0 и 20.5 V2- 16.8 V3- 13.9 V413.9 V5 - 7.68 Pressure...
punng Learning Jump to A pressure versus volume (pV) diagram is shown in the figure below...
 punng Learning Jump to A pressure versus volume (pV) diagram is shown in the figure below for a system. The arrows of the curve indicate the direction of the process and the points of interest are labelled. Calculate the amount of work done on the system from 0-2 and then for the entire curve 0 -5. The values for the points in the diagram are Volume (m')Prentsure Pa Pressure (Pa) Po 1.00 x10 P1 1.00×10⁴ P2 = 5.76 x 10³...
A pressure versus volume (P-V) diagram for a system is shown in the figure. The arrows...
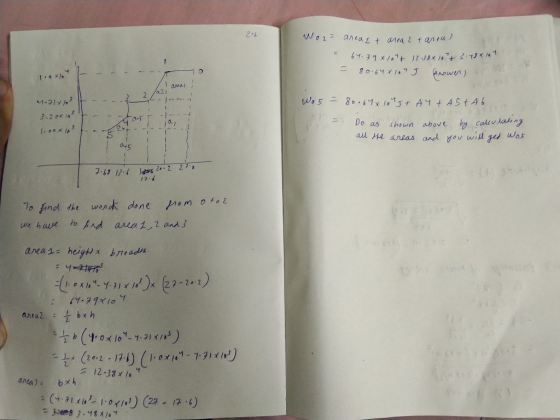
 A pressure versus volume (P-V) diagram for a system is shown in the figure. The arrows of the curve indicate the direction of the process, and the points of interest are labeled. The values for the points in the diagram are shown in the table. Pressure (Pa) Volume (m) Vo = 27.0 Vi = 20.2 V2 = 17.4 Vj = 14.2 V = 14.2 Vs = 7.51 Pressure (Pa) Po = 1.37 104 P1 = 1.37 104 P2 = 6.18...
A pressure versus volume (P-V) diagram for a system is shown in the figure. The arrows...
 A pressure versus volume (P-V) diagram for a system is shown in the figure. The arrows of the curve indicate the direction of the process, and the points of interest are labeled. The values for the points in the diagram are shown in the table. Volume (m³) Pressure (Pa) 3 Vo = 27.4 Po = 1.00 × 10⁴ V1 = 21.7 Pi = 1.00 x 10⁴ V2 = 16.0 P2 = 5.13 x 10³ V3 = 13.6 P3 = 5.13...
A pressure versus volume (P-V) diagram for a system is shown in the figure. The arrows...
 A pressure versus volume (P-V) diagram for a system is shown in the figure. The arrows of the curve indicate the direction of the process, and the points of interest are labeled. The values for the points in the diagram are shown in the table. Pressure (Pa) Volume (m) Pressure (Pa) V = 25.0 Po = 1.00 x 10 Vi = 21.4 P1 = 1.00 x 10 V2 = 17.2 P2 = 6.18 x 10 V3 = 13.6 P3 =...
A pressure versus volume (P-V) diagram for a system is shown in the figure. The arrows...
 A pressure versus volume (P-V) diagram for a system is shown in the figure. The arrows of the curve indicate the direction of the process, and the points of interest are labeled. The values for the points in the diagram are shown in the table. Volume (m) Pressure (Pa) Vo = 26.6 Po = 1.37 x 10⁴ Vi = 19.3 P1 = 1.37 x 10⁴ V2 = 17.0 P2 = 4.50 x 10 V3 = 13.9 P = 4.50 x...
A pressure versus volume (P-V) diagram for a system is shown in the figure. The arrows...
 A pressure versus volume (P-V) diagram for a system is shown in the figure. The arrows of the curve indicate the direction of the process, and the points of interest are labeled. The values for the points in the diagram are shown 0 in the table. Volume (m2) Pressure (Pa) Po = 1.37 x 10 Vo 26.6 Pi 1.37 x 10⁴ И 3 =21.7 2=16.2 P2 5.97 x 10³ V 13.3 Ps 5.97 x 10 V4=13.3 P4 3.20 x 10³...
A pressure versus volume (P-V) diagram for a system is shown in the figure. The arrows...
 A pressure versus volume (P-V) diagram for a system is shown in the figure. The arrows of the curve indicate the direction of the process, and the points of interest are labeled. The values for the points in the diagram are shown in the table. 0 Volume (m Pressure (Pa) Po 1.37 x 10⁴ 19.9 | p,-1.37x10⁴ 2 16.6 P2 5.13 x 10³ Ps 5.13 x 10³ P4 2.92 x 10³ 8:19 | ps = 1.57x10³ , = 13.6 Calculate...
 A pressure versus volume (pV) is shown in the figure
below........
A pressure versus volume (pV) diagram is shown in the figure below for a system. The arrows of the curve indicate the direction of the process and the points of interest are labelled. Calculate the amount of work done on the system from 0 2 and then for the entire curve 0-5. The values for the points in the diagram are Volume (m3) Vo-27.0 и 20.2 V217.6 V3- 14.2...
A pressure versus volume (pV) is shown in the figure
below........
A pressure versus volume (pV) diagram is shown in the figure below for a system. The arrows of the curve indicate the direction of the process and the points of interest are labelled. Calculate the amount of work done on the system from 0 2 and then for the entire curve 0-5. The values for the points in the diagram are Volume (m3) Vo-27.0 и 20.2 V217.6 V3- 14.2...
 A pressure versus volume (pV) diagram is shown in the figure below for a system. The arrows of the curve indicate the direction of the process and the points of interest are labelled. Calculate the amount of work done on the system from 0 - 2 and then for the entire curve 0 - 5 . The values for the points in the diagram are Volume (m3) Vo 25.0 и 20.5 V2- 16.8 V3- 13.9 V413.9 V5 - 7.68 Pressure...
 punng Learning Jump to A pressure versus volume (pV) diagram is shown in the figure below for a system. The arrows of the curve indicate the direction of the process and the points of interest are labelled. Calculate the amount of work done on the system from 0-2 and then for the entire curve 0 -5. The values for the points in the diagram are Volume (m')Prentsure Pa Pressure (Pa) Po 1.00 x10 P1 1.00×10⁴ P2 = 5.76 x 10³...
 A pressure versus volume (P-V) diagram for a system is shown in the figure. The arrows of the curve indicate the direction of the process, and the points of interest are labeled. The values for the points in the diagram are shown in the table. Pressure (Pa) Volume (m) Vo = 27.0 Vi = 20.2 V2 = 17.4 Vj = 14.2 V = 14.2 Vs = 7.51 Pressure (Pa) Po = 1.37 104 P1 = 1.37 104 P2 = 6.18...
 A pressure versus volume (P-V) diagram for a system is shown in the figure. The arrows of the curve indicate the direction of the process, and the points of interest are labeled. The values for the points in the diagram are shown in the table. Volume (m³) Pressure (Pa) 3 Vo = 27.4 Po = 1.00 × 10⁴ V1 = 21.7 Pi = 1.00 x 10⁴ V2 = 16.0 P2 = 5.13 x 10³ V3 = 13.6 P3 = 5.13...
 A pressure versus volume (P-V) diagram for a system is shown in the figure. The arrows of the curve indicate the direction of the process, and the points of interest are labeled. The values for the points in the diagram are shown in the table. Pressure (Pa) Volume (m) Pressure (Pa) V = 25.0 Po = 1.00 x 10 Vi = 21.4 P1 = 1.00 x 10 V2 = 17.2 P2 = 6.18 x 10 V3 = 13.6 P3 =...
 A pressure versus volume (P-V) diagram for a system is shown in the figure. The arrows of the curve indicate the direction of the process, and the points of interest are labeled. The values for the points in the diagram are shown in the table. Volume (m) Pressure (Pa) Vo = 26.6 Po = 1.37 x 10⁴ Vi = 19.3 P1 = 1.37 x 10⁴ V2 = 17.0 P2 = 4.50 x 10 V3 = 13.9 P = 4.50 x...
 A pressure versus volume (P-V) diagram for a system is shown in the figure. The arrows of the curve indicate the direction of the process, and the points of interest are labeled. The values for the points in the diagram are shown 0 in the table. Volume (m2) Pressure (Pa) Po = 1.37 x 10 Vo 26.6 Pi 1.37 x 10⁴ И 3 =21.7 2=16.2 P2 5.97 x 10³ V 13.3 Ps 5.97 x 10 V4=13.3 P4 3.20 x 10³...
 A pressure versus volume (P-V) diagram for a system is shown in the figure. The arrows of the curve indicate the direction of the process, and the points of interest are labeled. The values for the points in the diagram are shown in the table. 0 Volume (m Pressure (Pa) Po 1.37 x 10⁴ 19.9 | p,-1.37x10⁴ 2 16.6 P2 5.13 x 10³ Ps 5.13 x 10³ P4 2.92 x 10³ 8:19 | ps = 1.57x10³ , = 13.6 Calculate...
Most questions answered within 3 hours.
-
The Problem: The Case of the Harmonizing Vacations
Your CEO is exploring partnering with a European...
asked 44 minutes ago -
A chemical equation is balanced by adding coefficients in front
of some formulas so that the...
asked 43 minutes ago -
From the literature (reference your sources): What are the
lattice parameters of calcite and aragonite? Why...
asked 1 hour ago -
Your system is rejecting the question am asking which is
preceded by a case study. It...
asked 1 hour ago -
3. On January 2, 2000, Larry creates a trust with himself as
trustee. Larry as trustee...
asked 1 hour ago -
A member of the volleyball team spikes the ball. During this
process, she changes the velocity...
asked 1 hour ago -
Are adult gamers less likely to use a gaming console (Xbox,
PlayStation, Wii, etc...) than teen...
asked 2 hours ago -
The University of
Texas recently reported that 43% of college students aged 18-24
would spend their...
asked 2 hours ago -
The length of stay at a specific emergency department in
Phoenix, Arizona, in 2009 had a...
asked 1 hour ago -
. Please give the mechanism for this type of problem. Step by
Step
The toxin that...
asked 1 hour ago -
If you have a 1M stock solution and you want to dilute 1 :10
with water,...
asked 1 hour ago -
In a load instruction, the effective address is obtained by
A) Retriving the address from a...
asked 1 hour ago