
Homework Answers
a)

sample mean =45.692 (thousands)
sample standad deviation =11.302 (thousand)
b)

sample mean =50.692 (thousands)
sample standad deviation =11.302 (thousand)
c)
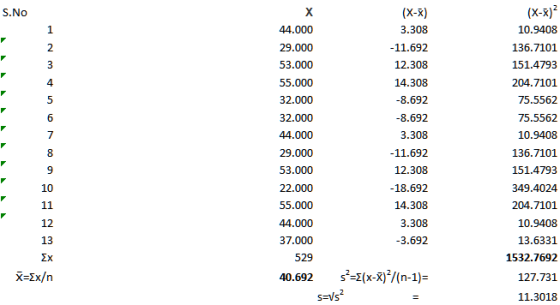
sample mean =40.692 (thousands)
sample standad deviation =11.302 (thousand)
d)
we conclude that standard deviation does not get afftected if a constant amount is added or subtracted from each value ; while average value increase or decrease by same amount.
Add Answer to:
Sample annual salaries (in thousands of dollars) for employees at a company are listed 49 34 58 60 37 37 49 34 58 27 60 49 42 (a) Find the sample mean and sample standard deviation (b) Each employee...
Sample annual salaries (in thousands of dollars) for employees at a company are listed. 55 42 ...
Sample annual salaries (in thousands of dollars) for employees at a company are listed. 55 42 46 58 29 29 55 42 46 26 58 55 50 (b) Each employee in the sample is given a 6% raise. Find the sample mean and sample standard deviation for the revised data set. (c) To calculate the monthly salary, divide each original salary by 12. Find the sample mean and sample standard deviation for the revised data set. (d) What can...
Sample annual salaries (in thousands of dollars) for employees at a company are listed. 44 54 ...
Sample annual salaries (in thousands of dollars) for employees at a company are listed. 44 54 47 49 27 27 44 54 47 33 49 44 41 (a) Find the sample mean and sample standard deviation. (b) Each employee in the sample is given a $5000 raise. Find the sample mean and sample standard deviation for the revised data set. (c) Each employee in the sample takes a pay cut of $4000 from their original salary. Find the sample mean...
Sample annual salaries (in thousands of dollars) for employees at a company are listed. 40 33 ...
Sample annual salaries (in thousands of dollars) for employees at a company are listed. 40 33 54 52 28 28 40 33 54 27 52 40 45 a. Find the sample mean and sample standard deviation. (b) Each employee in the sample is given a $22000 raise. Find the sample mean and sample standard deviation for the revised data set. (c) Each employee in the sample takes a pay cut of $55000 from their original salary. Find the sample...
Statistics and probability
Sample annual salaries in thousands of dollars for employees add a company are listed.41, 45, 49, 53, 34, 34, 41, 45, 49, 30, 53, 41, 46A. Find the sample mean in sample standard deviation.B. Each employee in the sample is given a $5000 raise. Find the sample mean in sample standard deviation for the revised data set.C. Each employee in the sample takes a pay cut of $2000 from their original salary. Find the sample mean in the sample standard...
A sample was taken of the salaries of 20 employees from a large company. The following...
A sample was taken of the salaries of 20 employees from a large company. The following are the salaries (in thousands of dollars) for this year (the data are ordered): 28, 31, 34, 35, 37, 41, 42, 42, 42, 47, 49, 51, 52, 52, 60, 61, 67, 72, 75, 77. Suppose each employee in the company receives a $3000 raise for next year (each employees salary is increased by $3000). The interquartile range of the salaries will A) increase by...
Scaling Data Sample annual salaries (in thousands of dollars) for employees at a company are listed....
 Scaling Data Sample annual salaries (in thousands of dollars) for employees at a company are listed. 42 36 48 51 39 39 42 36 48 33 39 42 45 50
Calculate the sample standard deviation for this data set: 58, 60, 74. The formula for the...
 Calculate the sample standard deviation for this data set: 58, 60, 74. The formula for the sample standard deviation is shown, where n represents the sample size, x represents each value in the data set, and X represents the sample mean. 2(x-x) n- Step 1. Calculate the sample mean. x=164 Step 2. Calculate the deviations and the squares of the deviations deviation of 58 - square of deviation of 58- deviation of 60 square of deviation of 60- deviation of...
Calculate the range, mean, mode, median, Standard deviation Calculate the skewness and kurtosis for the above...
Calculate the range, mean, mode, median, Standard deviation Calculate the skewness and kurtosis for the above data and interpret the data. The following is data collected from the daily salary employees of ZZ COMPANY.. 68 19 43 11 37 30 19 67 65 34 96 23 93 73 46 39 21 12 89 52 33 21 18 57 80 56 91 62 56 48 84 23 78 96 49 36 90 42 65 15 43 36 65 59 34 71...
For each variable of interest, do the following: 1. Find the mean, five-number summary, range, variance,...
For each variable of interest, do the following: 1. Find the mean, five-number summary, range, variance, and standard deviation. Display these numbers in a format that is easy to understand. 2. For each variable of interest, use its five-number summary to construct a boxplot. Each boxplot must be constructed horizontally, and must be accompanied by a brief descriptive paragraph that assesses whether the data appear to be symmetrical, left-skewed, or right-skewed. Construct a 95% confidence interval for the mean μ...
b) Calculate the standard deviation of the ages for the First Six U.S. Presidents by hand...
 b) Calculate the standard deviation of the ages for the First Six U.S. Presidents by hand by answering the following questions and filling in the table. We will want our final answer to be correct to 3 decimal places. So, to make sure we don't get any rounding error, we will do all calculations to 6 decimal places until the final answer. (1point each) Round each answer to 6 decimal places. (X) of the First Six Presidents? What is the...
 Scaling Data Sample annual salaries (in thousands of dollars) for employees at a company are listed. 42 36 48 51 39 39 42 36 48 33 39 42 45 50
 Calculate the sample standard deviation for this data set: 58, 60, 74. The formula for the sample standard deviation is shown, where n represents the sample size, x represents each value in the data set, and X represents the sample mean. 2(x-x) n- Step 1. Calculate the sample mean. x=164 Step 2. Calculate the deviations and the squares of the deviations deviation of 58 - square of deviation of 58- deviation of 60 square of deviation of 60- deviation of...
 b) Calculate the standard deviation of the ages for the First Six U.S. Presidents by hand by answering the following questions and filling in the table. We will want our final answer to be correct to 3 decimal places. So, to make sure we don't get any rounding error, we will do all calculations to 6 decimal places until the final answer. (1point each) Round each answer to 6 decimal places. (X) of the First Six Presidents? What is the...
Most questions answered within 3 hours.
-
1. An object weighing 40 N rests on a surface. The coefficient
of friction is 0.35....
asked 12 minutes ago -
Investor company owns 35% of investee company voting stock and
accounts for the investment under the...
asked 1 hour ago -
The number of major faults on a randomly chosen 1 km stretch of
highway has a...
asked 1 hour ago -
Consider the competitive environment of Starbuck's, Progressive
Insurance, a manufacturing firm with low turnover, or a...
asked 2 hours ago -
3. Gains from trade
Consider two neighbouring island countries called Euphoria and
Contente. They each have...
asked 4 hours ago -
A business executive has the option to invest money in two
plans: Plan A guarantees that...
asked 6 hours ago -
Hello, can someone please help me answer this question?
How much heat is absorbed by a...
asked 6 hours ago -
. A marketing researcher conducted a survey of 25 shoppers
randomly selected at the local mall...
asked 6 hours ago -
Create an comprehensive response to the
following:
Antimicrobial agents work on a multitude of microbes (bacteria,...
asked 6 hours ago -
6.13 LAB: Step counter. Section 6.3.
A pedometer treats walking 2,000 steps as walking 1 mile....
asked 6 hours ago -
(14.2) A block of mass m = 10 kg riding on a frictionless
horizontal plane is...
asked 6 hours ago -
Use any search engine to search for articles about Starbucks
partnership with Tata Companies in India...
asked 6 hours ago