
Homework Answers
Add Answer to:
1. Sid Orland is involved in planning a scientific research project. The activities are displayed in the following...
Using the following information about Project A, its activities and predecessor activities below: Activity Predecessors A...
 Using the following information about Project A, its activities and predecessor activities below: Activity Predecessors A в B C D E, F D G The following table contains the pessimistic, likely, and optimistic estimates for how long activities are estimated to take for Project A. Activity Pessimistic Likely Optimistic 2 5 20 H 16 e. Calculate the time estimates (TE) f. Calculate the variance (s) g. Convert the TE to whole integers and place them in the network diagram for...
The estimated times and immediate predecessors for the activities in a project at Caesar Douglas’s screening...
The estimated times and immediate predecessors for the activities in a project at Caesar Douglas’s screening company are given in the following table. Assume that the activity times are independent. All times are in weeks. Activity Predecessors Optimistic Time (a) Most Likely Time (m) Pessimistic Time (b) A -- 9 10 11 B -- 4 10 16 C A 9 10 11 D B 5 8 11 What is the critical path based on expected times? You may use any...
Pik-Fast, a chain of convenience stores, is planning to open a new store. The activities required, their...
Pik-Fast, a chain of convenience stores, is planning to open a new store. The activities required, their immediate predecessors, and the optimistic, most likely, and pessimistic estimates of their times (in days) are provided below. Activity Description Immediate Predecessors Optimistic Time (days) Most Likely Time (days) Pessimistic Time (days) TE ES EF LF LS Slack Standard Dev Variance A Select manager -- 10 12 20 13 0 1.67 B Select site -- 8 15 22 15 0 2.33 C Hire workers...
5. A project has critical path activities A, B, and C. A is the predecessor of B. B is the predec...
 5. A project has critical path activities A, B, and C. A is the predecessor of B. B is the predecessor of C. The duration estimate for activity A, B and C is shown in the following table. Fill the table with mean duration, standard deviation, and variance for activities and the whole project (critical path). Determine what is the probability of completing this project within 80 days? (10 points) Activity Optimistic Pessimistic Most likely Mean Standard Variance deviation duration...
Pik-Fast, a chain of convenience stores, is planning to open a new store. The activities required, their...
Pik-Fast, a chain of convenience stores, is planning to open a new store. The activities required, their immediate predecessors, and the optimistic, most likely, and pessimistic estimates of their times (in days) are provided below. Activity Description Immediate Predecessors Optimistic Time (days) Most Likely Time (days) Pessimistic Time (days) TE ES EF LF LS Slack Standard Dev Variance A Select manager -- 10 12 20 13 0 1.67 B Select site -- 8 15 22 15 0 2.33 C Hire workers...
(50 points) Data regarding the activities for a project are presented below. The times are in...
 (50 points) Data regarding the activities for a project are presented below. The times are in weeks The critical path for this project is A-D-H-I-J-K 2. Pessimistic Time Most Likely Time y Optimistic Time 8 16 10 8 10 12 8 14 5 6 2 a. Determine the standard deviation of the critical path. b. Determine the probability of completing the project in 38 weeks or less c What is the probability of completing the project in 32 weeks or...
The table below gives the optimistic, most-likely, and pessimistic time estimates (in weeks) for all activities in a project. (Statistical tables are available in appendix I) Activ Predecessor totm t...
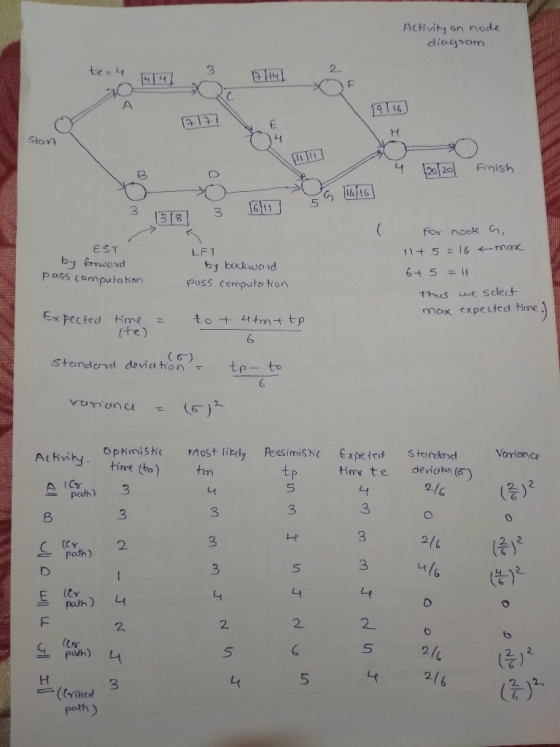
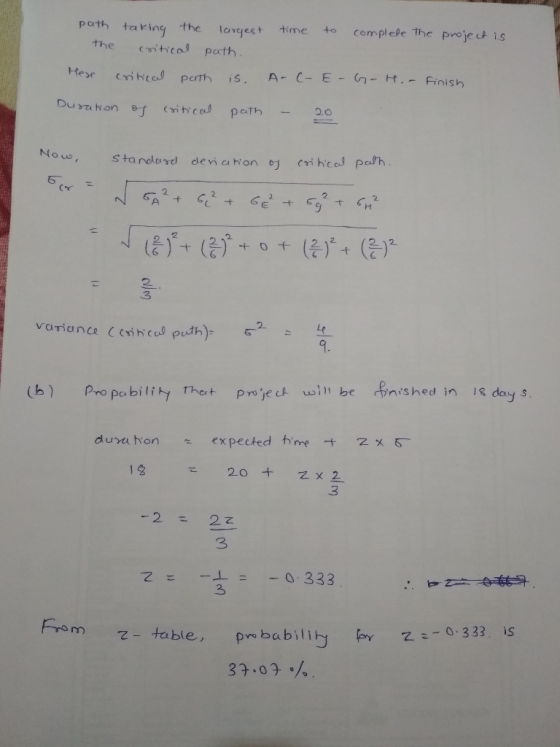
 The table below gives the optimistic, most-likely, and pessimistic time estimates (in weeks) for all activities in a project. (Statistical tables are available in appendix I) Activ Predecessor totm t 2.0 5.0 8.0 3.0 4.0 5.0 4.06.08.0 5.0 6.0 7.0 3.0 6.0 9.0 D, E (i) Calculate the estimated time and variance for each task (ii) Draw the AON diagram and identify the critical path. (iii) What is the expected critical path duration and estimate a standard deviation for the...
The following table shows estimates of activity times (weeks) for a project: Activity Optimistic Time Most...
The following table shows estimates of activity times (weeks) for a project: Activity Optimistic Time Most Probable Time Pessimistic Time A 3 4.5 9 B 1.5 2 2.5 C 5 6 7 D 4 4.5 8 E 5 6 7 F 1 2.5 7 G 7 9 11 Suppose that the critical path is A-B-D-F-G. Use Appendix A to answer the questions. Do not round intermediate calculations. Round your answers to three decimal places. What is the probability that the...
Consider the following project activities: Calculate the expected time (te) for each activity. Draw an Activity...
 Consider the following project activities:
Calculate the expected time (te) for each
activity.
Draw an Activity on Node (AON) diagram to reflect the flow of
these activities.
Calculate the Early Start (ES), Early Finish (EF), Late Start
(LS), and Late Finish (LF) for each activity.
Calculate the slack for each activity.
Identify all activities on the Critical Path.
Use the data to calculate the probability the project will
finish in 20 weeks (Hint: z-score).
Activity A 8 с D E...
Consider the following project activities:
Calculate the expected time (te) for each
activity.
Draw an Activity on Node (AON) diagram to reflect the flow of
these activities.
Calculate the Early Start (ES), Early Finish (EF), Late Start
(LS), and Late Finish (LF) for each activity.
Calculate the slack for each activity.
Identify all activities on the Critical Path.
Use the data to calculate the probability the project will
finish in 20 weeks (Hint: z-score).
Activity A 8 с D E...
#1 #2 #3 #4 Time Estimates (in weeks) for SOM's Bus Project is given in the...
 #1
#2
#3
#4
Time Estimates (in weeks) for SOM's Bus Project is given in the following table. Activity Optimistic time Most likely time Pessimistic time A 2 4 6 B 3 5 8 Ic с 4 6 8 D 3 5 10 Please help the project management team to find the standard deviation of Activity D. keep two decimals if not exact, either round up or down is ok. For example, for 0.1346, (0.13 or 13) and (0.14 or.14)...
#1
#2
#3
#4
Time Estimates (in weeks) for SOM's Bus Project is given in the following table. Activity Optimistic time Most likely time Pessimistic time A 2 4 6 B 3 5 8 Ic с 4 6 8 D 3 5 10 Please help the project management team to find the standard deviation of Activity D. keep two decimals if not exact, either round up or down is ok. For example, for 0.1346, (0.13 or 13) and (0.14 or.14)...
 Using the following information about Project A, its activities and predecessor activities below: Activity Predecessors A в B C D E, F D G The following table contains the pessimistic, likely, and optimistic estimates for how long activities are estimated to take for Project A. Activity Pessimistic Likely Optimistic 2 5 20 H 16 e. Calculate the time estimates (TE) f. Calculate the variance (s) g. Convert the TE to whole integers and place them in the network diagram for...
 5. A project has critical path activities A, B, and C. A is the predecessor of B. B is the predecessor of C. The duration estimate for activity A, B and C is shown in the following table. Fill the table with mean duration, standard deviation, and variance for activities and the whole project (critical path). Determine what is the probability of completing this project within 80 days? (10 points) Activity Optimistic Pessimistic Most likely Mean Standard Variance deviation duration...
 (50 points) Data regarding the activities for a project are presented below. The times are in weeks The critical path for this project is A-D-H-I-J-K 2. Pessimistic Time Most Likely Time y Optimistic Time 8 16 10 8 10 12 8 14 5 6 2 a. Determine the standard deviation of the critical path. b. Determine the probability of completing the project in 38 weeks or less c What is the probability of completing the project in 32 weeks or...
 The table below gives the optimistic, most-likely, and pessimistic time estimates (in weeks) for all activities in a project. (Statistical tables are available in appendix I) Activ Predecessor totm t 2.0 5.0 8.0 3.0 4.0 5.0 4.06.08.0 5.0 6.0 7.0 3.0 6.0 9.0 D, E (i) Calculate the estimated time and variance for each task (ii) Draw the AON diagram and identify the critical path. (iii) What is the expected critical path duration and estimate a standard deviation for the...
 Consider the following project activities:
Calculate the expected time (te) for each
activity.
Draw an Activity on Node (AON) diagram to reflect the flow of
these activities.
Calculate the Early Start (ES), Early Finish (EF), Late Start
(LS), and Late Finish (LF) for each activity.
Calculate the slack for each activity.
Identify all activities on the Critical Path.
Use the data to calculate the probability the project will
finish in 20 weeks (Hint: z-score).
Activity A 8 с D E...
Consider the following project activities:
Calculate the expected time (te) for each
activity.
Draw an Activity on Node (AON) diagram to reflect the flow of
these activities.
Calculate the Early Start (ES), Early Finish (EF), Late Start
(LS), and Late Finish (LF) for each activity.
Calculate the slack for each activity.
Identify all activities on the Critical Path.
Use the data to calculate the probability the project will
finish in 20 weeks (Hint: z-score).
Activity A 8 с D E...
 #1
#2
#3
#4
Time Estimates (in weeks) for SOM's Bus Project is given in the following table. Activity Optimistic time Most likely time Pessimistic time A 2 4 6 B 3 5 8 Ic с 4 6 8 D 3 5 10 Please help the project management team to find the standard deviation of Activity D. keep two decimals if not exact, either round up or down is ok. For example, for 0.1346, (0.13 or 13) and (0.14 or.14)...
#1
#2
#3
#4
Time Estimates (in weeks) for SOM's Bus Project is given in the following table. Activity Optimistic time Most likely time Pessimistic time A 2 4 6 B 3 5 8 Ic с 4 6 8 D 3 5 10 Please help the project management team to find the standard deviation of Activity D. keep two decimals if not exact, either round up or down is ok. For example, for 0.1346, (0.13 or 13) and (0.14 or.14)...
Most questions answered within 3 hours.
-
(63
#14)
which of the following statments best describes how chamging
the concentration of the substances...
asked 1 hour ago -
In the following reaction, which element is undergoing
oxidation: Na2SO3 + N2O --> N2 + Na2SO4...
asked 2 hours ago -
Which of the following pairs of ions have the same electron
configuration?
I: Br− and Se2−...
asked 5 hours ago -
The Foremost Composite Materials Company is planning a two-day
sales conference for October 19-20. The conference...
asked 5 hours ago -
3) Illustrate the observed pattern of relatedness of organisms
versus adaptations to specific conditions. This means...
asked 5 hours ago -
In winter a lake has a 0.35 m thick ice layer over 1.10 m of
water....
asked 6 hours ago -
Assuming the following has been encrypted with a Vigenere cipher
below, use the method(s) and assumptions...
asked 7 hours ago -
How would I use switch statements to write a program that will
take an input of...
asked 7 hours ago -
Imagine a reaction in which methane gas combusts at a constant
pressure of 1 atm and...
asked 7 hours ago -
Two parallel wires (each 12 m in length) are separated by a
distance of 0.065 m...
asked 7 hours ago -
Suppose there were three masses at the corner of uniform
equilateral triangle. The masses are m1...
asked 7 hours ago -
Situation: A building that is 618 m above the ground floor. How
many times would a...
asked 7 hours ago