


Homework Answers


Add Answer to:
#1
#2
#3
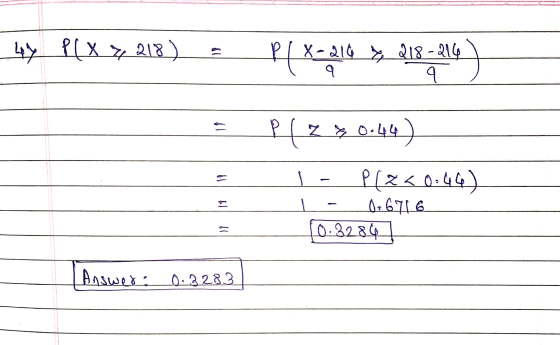
#4
Time Estimates (in weeks) for SOM's Bus Project is given in the...
NETWORK: PERT 4 - Consider the following table: ACTIVITY PREC. ACT. TIME ESTIMATES tml - 2...
 NETWORK: PERT 4 - Consider the following table: ACTIVITY PREC. ACT. TIME ESTIMATES tml - 2 (days) tp c D, E 1) Construct a PERT network. [NOTE: This is the most crucial part of the exercise. Make sure you have the correct network before proceeding to the next sections.) 2) By using ES, EF, LF, LS, find the slack of each activity and the critical path. 3) Find the completion time (x) and the standard deviation (6) for the project-...
PART I: PERT Consider the following table: ACTIVITY PREC. ACT. TIME ESTIMATES (days) &n
PART I: PERT Consider the following table: ACTIVITY PREC. ACT. TIME ESTIMATES (days) to tml tp te A --- 2 3 4 B A 2 4 6 C A 4 6 8 D A 4 5 6 E B 6 7 8 F D 1 3 5 G E, C, F 3 5 7 1. Construct a PERT network. (20 points) [NOTE: This...
A partially solved PERT problem is detailed in the table below. Times are given in weeks....
A partially solved PERT problem is detailed in the table below. Times are given in weeks. Activity Preceding Optimistic Time Probable Time Pessimistic Time Expected Time Variance A -- 7 9 14 1.361 B A 2 2 8 0 C A 8 12 16 0 D A 3 5 10 1.361 E B 4 6 8 0 F B 6 8 10 0 G C, F 2 3 4 0 H D 2 2 8 1.000 I H 6 8...
HOMEWORK ASSIGNMENT FOR PROJECT MANAGEMENT 13. An automation project has the following activities and related data Time (weeks)Crash Immed. Maximum Activity Prede- Opti- Most Cost/week Crashable...
 HOMEWORK ASSIGNMENT FOR PROJECT MANAGEMENT 13. An automation project has the following activities and related data Time (weeks)Crash Immed. Maximum Activity Prede- Opti- Most Cost/week Crashable Mean Varice cessors mistic (a) Likely (m) mistic (c (S1000) Weeks E(t) V(t) C A 5 D A 4 E B1 F B1 G C,D,E 2 6 6 HF2 12 15 3 13a. (5 points) Compute the mean and variance of each activity and record them on the table above. 13b. (5 points) Develop...
16) A partially solved PERT problem is detailed in the table below. Times are given in...
 16) A partially solved PERT problem is detailed in the table below. Times are given in weeks. Optimisti Activity Preceding Time Probable Pessimistie Expected Time Time Time Variance 10 8 19 20 - 니다 4-ww0 8 16 14 1 2.79 276 G + - 5 (a) Calculate the expected time and variance for each activity. Enter these values in the appropriate columns in the table above. (b) Which activities form the critical path? (c) What is the estimated time of...
PERT Analysis: The following represents a project with four activities. All times are in weeks. Activity Immediate Predecessor Optimistic Time Most Likely Time Pessimistic Time A -...
PERT Analysis: The following represents a project with four activities. All times are in weeks. Activity Immediate Predecessor Optimistic Time Most Likely Time Pessimistic Time A - 3 8 14 B - 8 8 8 C A 6 9 18 D B 6 11 17 According to the data in the above Table: What is the critical path? What is the minimum expected completion time for the project? According to the above Table, there are four activities in the project....
1. The activities needed for a new project your company is undertaking are listed in the...
1. The activities needed for a new project your company is undertaking are listed in the following table. ACTIVITY IMMEDIATE PREDECESSOR(S) A ---- B ---- C A D A, B E B F C, D, E G D, E H F I F, G J G The activity times were determined for the project, and were as below. ACTIVITY ACTIVITY TIME (days) A 11 B 9 C 7 D 12 E 8 F 9 G 10 H 6 I 7...
Problem 9-14 Given the following activity times in months, determine the items listed below: Time Estimates...
 Problem 9-14 Given the following activity times in months, determine the items listed below: Time Estimates (months) Activity Activity Predecessor а т 4 12 A B 6 10 15 С 2 10 14 1 D A 4 13 E A 3 F В 3 6 18 G 2 8 12 Н С.Е.F С.Е.F 15 22 I 5 12 21 J D 20 25 K G.I 5 12 L Н.К 3 20 Expected activity times b. Variance times а. c. Earliest...
5. A project has critical path activities A, B, and C. A is the predecessor of B. B is the predec...
 5. A project has critical path activities A, B, and C. A is the predecessor of B. B is the predecessor of C. The duration estimate for activity A, B and C is shown in the following table. Fill the table with mean duration, standard deviation, and variance for activities and the whole project (critical path). Determine what is the probability of completing this project within 80 days? (10 points) Activity Optimistic Pessimistic Most likely Mean Standard Variance deviation duration...
123) Given (Time in weeks): Activity Optimistic Most Likely Pessimistic A 3 4 5 B 6...
123) Given (Time in weeks): Activity Optimistic Most Likely Pessimistic A 3 4 5 B 6 7 14 C 2 3 10 D 6 9 12 E 4 5 12 F 1 3 11 G 1 2 9 H 2 5 8 I 1 4 7 Determine: (a) the critical path. ( HOW DO I DO THIS WITH OUT A PREDECESSOR?) (b) the probability that the project will be completed in 22 weeks.
 NETWORK: PERT 4 - Consider the following table: ACTIVITY PREC. ACT. TIME ESTIMATES tml - 2 (days) tp c D, E 1) Construct a PERT network. [NOTE: This is the most crucial part of the exercise. Make sure you have the correct network before proceeding to the next sections.) 2) By using ES, EF, LF, LS, find the slack of each activity and the critical path. 3) Find the completion time (x) and the standard deviation (6) for the project-...
 HOMEWORK ASSIGNMENT FOR PROJECT MANAGEMENT 13. An automation project has the following activities and related data Time (weeks)Crash Immed. Maximum Activity Prede- Opti- Most Cost/week Crashable Mean Varice cessors mistic (a) Likely (m) mistic (c (S1000) Weeks E(t) V(t) C A 5 D A 4 E B1 F B1 G C,D,E 2 6 6 HF2 12 15 3 13a. (5 points) Compute the mean and variance of each activity and record them on the table above. 13b. (5 points) Develop...
 16) A partially solved PERT problem is detailed in the table below. Times are given in weeks. Optimisti Activity Preceding Time Probable Pessimistie Expected Time Time Time Variance 10 8 19 20 - 니다 4-ww0 8 16 14 1 2.79 276 G + - 5 (a) Calculate the expected time and variance for each activity. Enter these values in the appropriate columns in the table above. (b) Which activities form the critical path? (c) What is the estimated time of...
 Problem 9-14 Given the following activity times in months, determine the items listed below: Time Estimates (months) Activity Activity Predecessor а т 4 12 A B 6 10 15 С 2 10 14 1 D A 4 13 E A 3 F В 3 6 18 G 2 8 12 Н С.Е.F С.Е.F 15 22 I 5 12 21 J D 20 25 K G.I 5 12 L Н.К 3 20 Expected activity times b. Variance times а. c. Earliest...
 5. A project has critical path activities A, B, and C. A is the predecessor of B. B is the predecessor of C. The duration estimate for activity A, B and C is shown in the following table. Fill the table with mean duration, standard deviation, and variance for activities and the whole project (critical path). Determine what is the probability of completing this project within 80 days? (10 points) Activity Optimistic Pessimistic Most likely Mean Standard Variance deviation duration...
Most questions answered within 3 hours.
-
In 1970s and 1980s, molecular biologists discovered that the
hormone testosterone, binds a receptor protein that...
asked 43 minutes ago -
january 1 2010 road catering service purchase a piece of
equipment for 58000 which is expected...
asked 1 hour ago -
Explain Mertons concept of anomie is and what the
modes of adaptation to it are?
asked 1 hour ago -
Jamie is doing a survey at her school about whether the students
feel the cafeteria food...
asked 3 hours ago -
How many liters of 0.669 M KOH will be needed to raise the pH of
0.339...
asked 5 hours ago -
A liquid of density 1270 kg/m 3 flows steadily through a pipe of
varying diameter and...
asked 5 hours ago -
Questions: What should the American executive do?
'A visiting American executive finds that a foreign subsidiary...
asked 5 hours ago -
Activity based costing was introduced as an alternative to
absorption costing.
1. Discuss using illustration the...
asked 5 hours ago -
1. You own shares of Crane DVD Company and are interested in
selling them. With so...
asked 5 hours ago -
How many grams of He are necessary to fill a balloon having a
volume of 4.5E3...
asked 5 hours ago -
The 2 patients, still in the hospital, were interviewed by a
MoH epidemiologist. The interviews revealed...
asked 6 hours ago -
An uncharged capacitor and a resistor are connected in series to
a source of emf. If...
asked 6 hours ago